
Tuesday, August 31, 2010


Monday, August 30, 2010


Sunday, August 29, 2010
Weekly technical Analysis for week ended 28thAugust 2010.
Nifty opened on a positive note moved up and made a high of 5549 on Monday and there after started to fall and continued to fall the end of the week and finally the fall has intensified. The fall of the market during the week has broken below some of the significant resistance trend lines, but still above 5350. Till the market is above 5350 the bulls can has hope and if once if it is taken out then we can see a healthy fall at-least towards 5000 levels. One of the features of the current fall is that, nifty has broken the three months trend line, i.e. the trend line drawn from the low of may 2010, thus giving an indication that bears are at strongest point than in the last three months. It has also moved blow the 15 day EMA after flirting with it for the last one week and has decisively broken below it, indicating that bears have at-least come into the market for the time being. Whether it would be a long one or a short lived one only time will tell. One of the significant features of the current fall which every one has ignored till now is that nifty has broken the trend line drawn from the low of market 2009 indicating the we might have started a fall on larger time frame, but we have to wait for some more levels to be taken out before we can thing that longer time frame fall has started. The first and the foremost thing is we have to wait for faster retracement of the entire fall from May 2010. if this happens the we can safely assume the up move has completed if not then we can safely assume that the up trend is intake. The time series analysis which I have been mentioning from the beginning of the current year is clear enough for us to indicate probable reversal. But from the march 2009 onwards there has not been entire retracement of the rise so the trend was intake. In the last one and half years the fall have been any where near the 82% of the previous falls. The market was in a trading range of 4700-5500 from July 09 onwards. The rises were in the range of 10 weeks and the fall were in the range of 5 weeks with the exception of mar 2010 fall where it was 6 weeks. In five weeks market has corrected 82% of the rise; it took 10 to 11 weeks to retrace the entire fall. Here it is clear indicating the bulls were finding it difficult to take the market up but at-least they were successful in retracing the entire fall while the bears were not successful to retrace entire rise. I have also indicated in the beginning of the current month that market would not run away from the current levels as the retracement took longer time, even though majority of the analysts were gung ho on upward movement of the market once the 5500 level was breached. Unless and other wise the faster retracement of either fall or rise takes place we can safely assume that we are in the trading range and the market would be frusta ting us like this also. The current rise has taken 13 weeks (Fibonacci again) so we have to go below the May 2010 low of 4786 in shorter time than 13 weeks and preferably in 50% time. So if the down trend for at-least short term has started we have to see for faster retracement then only we can see market drifting down wards significantly till that time we can safely assume the we are still in bull market.
It can be seen from the chart below that nifty has broken below the last three months trend line thus giving an indication that the fall might be severe. Till market moves above it we can expect a severe fall.

 It can be seen from the chart above that nifty has fallen at-least by 500 points when ever the trend lines were broken as indicated in the chart. This time also nifty has broken the trend line drawn from march 2009 whether nifty would fall at-least by 500 points if would technically that would be disastrous for the market as that would break below so may technical support levels and also trend lines. I would furnish then where ever they happen.
Positives for Nifty:
§ Market is above 200 day EMA.
§ Market is above 50 day or 100 day EMA.
§ Weekly MACD is in a buy mode.
§ Weekly RSI has started to move up sharply indicating strength of up move.
Negatives for nifty:
§ Market has moved below the 15 day EMA
§ The rise is on –ve divergences with MACD histogram and also RSI.
§ Daily MACD has given a sell signal
§ - D1 as moved above +D1 indicating that bears have gained upper hand and only now DMI should start moving up to indicate strength of bears.
Elliotte wave Analysis:
In Feb-March I have indicated in my Elliott study that it would be difficult nifty to move above 5415 and 5585 and now one is violated and we have see whether the second one would be violated. It appears clearly that nifty has failed to move past 5585 this time also and whether the wave-C has completed now it appears to be so as of now. The wave break up is indicated in the below chart. The detailed analysis along with the targets I would furnish when the faster retracement of the last wave happens,

Directional Momentum index – (DMI)
Currently –D1 has moved above +D1 indicating strength for the bears. But Now we have to wait for DMI to move upwards presently it is moving down even though it is placed at 20 levels.
M.Sri Mahidar
Sunday 29thAugust 2010, Time 19.48 IST
Trend is friend
Wednesday, August 25, 2010


Tuesday, August 24, 2010

Thursday, August 19, 2010
Wednesday, August 18, 2010

Nifty in Point and figure chart (above) is pointing towards a very interesting figure in daily charts. It has formed a for box bottom and also Four box top which is clearly a giving an indication of indecisiveness. Any break above 5500 would result in a bullish break out which has potential of moving at-least 400 points and in the same way if any close below 5325 has same potential of moving down i.e atleast by 400 points.
M.Sri Mahidar
Trend is friend.

Monday, August 16, 2010


Sunday, August 15, 2010
nifty weekly
Weekly technical Analysis for week ended 14thAugust 2010.
Nifty has behaved in a in a peculiar way it has opened on a strong note on Monday and moved up and there after for the next three days fell sharply and on Friday recovered swiftly to closed the week on positive note. As per candle and stick parlance it has formed a star indicating indecisiveness in the market. It gives a clear indication that there is a clear fighting going on between the bulls and bears and they are not in a position to determine as to who is stronger. Who ever emerges stronger the market would go in that direction in a very very big way and also very swiftly and it might take every body by surprise. The odds are in favor of the down ward movement of the market. Now presently for the last five weeks nifty is stuck between ranges of 5350-5500. So it clearly states that market has moved nowhere and it is very very disgusting for the trader when markets moves in such a narrow range. It clearly states that the trader should immediately book profits in such range bound market as the market might reverse in a very short period. So as of now any movement of nifty above 5500 and below 5350 would result in that direction other wise we have to again stay in this range for another week. The real action was out side the market where very very steep rises were noticed randomly. First Tata Motors has moved up sharply after it results and there after SBI went into frenzy mode once it released its spectacular results. In the present scenario it appears that the market is being clearly operated as one stocks moved in a frenzy mode and after two or three days another stock moved up in a frenzy mode. Generally as has been observed in the past such type of movement takes place when market is nearing tops. If the market does not correct from current levels such type of frenzy moves may be seen in some other big cap stocks and there after market might also move in such a frenzy way to catch the retail investors again and fall there after very violently there by again catch the innocent retail investors. If we see the movement as on march, April 2009 and now, in 2009 the stocks were moving up steadily up and if we observe we can clearly see that stocks are raising by 20-30-40% terms in three to four days there by resulting in break out phenomenon but they ultimately they correct to the break out level. During the last one month or so we can see so many stocks which are raising vertically and that too with heavy volumes. So the break out of so many stock with vertical rises is a red flag as the same thing has happened in December 2007 giving an indication of break out and there after proved to be a false break out. So it is better to be cautious of these vertical rises.
If you observe divergences between the indices, this is quite alarming. As per Dow Theory when there are divergences between the indices then it is an indication that there is something wrong in the market and we should become cautious of our actions, but generally every body is carried away by the movement of the market as a whole. It can be seen or you might have observed over the last one month that where as Nifty and Sensex has not moved any where that is nifty is stuck in the range of 150 points and sensex in range of around 400 points. Bank nifty, and Cnx mid cap and nifty junior has been continually moving up making new 52 week highs. All these three indices have moved around 10% where as the major indices have not moved ever around 3% there by indicating a clear divergence. Generally these type of divergences happen at market tops or at bottoms. If you observe the markets movement in December 2007 and January 2008 these three indices were rising at a steeper rate than that of nifty and sensex and we know what has happened after that. If you observe the same in March 2009 these two indices were making a new 52 week now where as nifty and sensex did not make new lows and there after the markets rose and you also know what happened there after. It appears as of now that every body is ignoring the divergences between the indices and is slightly carried away by the general market movement. DOW Theory is saying or indicating us to be cautious. Bears need not also rejoice also as till now market has not given any reversal signals (faster retracement of the last wave) in their favor till that happens the market is in the hands of bulls. So bears have patience.
 Positives for Nifty:
§ Market is above 200 day EMA.
§ Market is above 50 day or 100 day EMA.
§ DMI has moved above 20 indicating strength of bulls.
§ Weekly MACD is in a buy mode.
§ Weekly RSI has started to move up sharply indicating strength of up move.
Negatives for nifty:
§ The rise is on –ve divergences with MACD histogram and also RSI.
§ Daily MACD has given a sell signal
§ +D1 is moving down sharply and –D is moving up sharply indicating that bears are started to have upper hand and also
Elliott wave:
In Feb-March I have indicated in my Elliott study that it would be difficult nifty to move above 5415 and 5585 and now one is violated and we have see whether the second one would be violated. This time it has failed to achieve the same.
Directional Momentum index – (DMI)
Currently +D1 is above –D1 and +D1 and +D1 has started to move down sharply and –D1 is moving up indicating the bears are gaining upper hand swiftly even the DMI has Started to move down indicating that bulls are loosing ground but still have upper hand..
M.Sri Mahidar
Sunday 15thAugust 2010, Time 19.16 IST
Trend is friend
Thursday, August 12, 2010


Wednesday, August 11, 2010


Tuesday, August 10, 2010

 The First chart is the market top of 2008 and the second one is the formation as of now. The top formation of 2008 started from October 2007 and ended in January 2008 total 4 months. the current formation has just compleated 13 months( fibonacci again). It can be seen from the above two charts that the pattern is some what similar we can say that virtually similar.
 The similarities are give below
- In the first chart, the formation is sloping upwards and now also the formation is sloping upwards.
- The first chart there are six waves formation after which the markets have corrected voilently and you know what has happened and its a history now. In the second chart which is the current one there are also six waves and we are in completion of the sixth wave
- Last time the markets broke down wards after completion of the sixthed wave,whether the market would follow the same pattern it followed in january 2008 after completion of the pattern. It appears from the chart that we are in the final stages of completion of the of the sixth wave so be cautious.
- Please also note the similarities of the each waves, in the first chart all the rises were in the range of 127% to 147% ( to be precise 147%,127% and 136%) of the previous waves. In the present case it is between 162%,123% and 115( not yet confirmed the completion.)
- In the first case each fall is around 65% of the previous rise, and in the current case the falls are in the ratio of 40% and 82% of the previous fall.
- If this pattern of the rise is to be followed we might see the 6th or the current up wave to move more that 123% of the previous down wave( which was of 613 points). So we should rise more than 753 points so nifty should atleast move above 5539. You may be worndering why? in the jan 2008 formation second rise was the shortest so now also the shortest one is the second up wave which is 123% so the third wave should be more than that.
We have to see whether the market would replicate the structure of the previous top formation or not. The pattern is suggesting the same but as the motto goes market is the king. The market is pointing towards one thing at present and i have just presented my view.
what ever side may be the break out the movement after the same would be very very voilent which is very difficult for any body to comprehend. So the patterns are suggesting us to be cautious. So just do that.
M.Sri Mahidar
Trend is friend.
Monday, August 9, 2010

Sunday, August 8, 2010
Weekly technical Analysis for week ended 8thAugust 2010.
Nifty surprisingly opened on a strong note and there after moved strongly for the next two days and on the last two day of the week. The important point to be noted is that nifty once again closed above 5400 which clearly shows the strength of the bulls. Nifty has to maintain above 5400 to indicate further strength of the bulls. Any move and close below 5400 and especially below 5350 on weekly basis would indicate weakness and has chances of taking nifty towards 5200-5000 levels at-least. So the coming weeks would indicate the strength or weakness of the bulls. It appears that when ever it is trying to move up selling pressure is coming to the market. It appears from the movement of the nifty that the bulls are able to maintain the market but they are unable to take it up as when ever they are taking slightly up they are facing a heavy selling from the bears. So it appears that any movement and close above 5500 has all chances of taking the market to the final blow off rally. If nifty successfully conquers 5500 then we have all fair chances of a blow off rally which would make markets move very fast to dizzy heights and might again prove to a big grave for the market. What ever may be the case the market is still in a bull mode and it would try to move further or at-least maintain these levels. As indicated above any breach of 5350 would indicated reversal on daily basis as it would form a lower low of the current rise from 4750 levels. So 5350 is the crucial level to be watched by the market participants.
One of the worrying features of the current rise is that, Reliance Industries is slowly drifting down and market is not noticing the same. RIL has broken the triangle formation for the last one year and is moving down slowly and is at 1000 levels, the volumes were also heavy on the break out. So till RIL moves up above 1050 the trend will be down. It may be noted that when ever RIL dose not move up along with the general market it is worrying factor. It has also lost the market participants observations and slowly drifting down and no one is caring above it, even though it is one of the most worrying factor. It has been observed that when ever RIL dose not participate in the rally and the market moves up and RIL moved down then it is a worry some factor as in all the times market has finally followed RIL eventually and in each of these cases it was the case of market top which was not easily breached. The target for RIL on break of the triangle comes to around 750-800 levels. Which is nearly 20% from current levels? If RIL tries to move to these levels then bulls have to surely worry on this front.
By the completion of the current weak nifty has been rising continuously for 11 weeks. And it has been observed that during the last one year nifty has been raising any where between 9-11 weeks and on the completion of 11 weeks constitutes a major event as it might indicate reversal for the short term as per time series analysis and whether it would materialize or nifty would continue to rise for another two weeks to complete 13 weeks which is the next immediate Fibonacci we have to wait and see. If time series is to be followed then we have chances of seeing market drifting down slowly
.

It may be noted that nifty is now placed at very important levels technically. It is now poised at very crucial support levels, on the down side the support levels are for last one year trend line which is the blue line and the white line and the dotted yellow line is the trend line drawn from the lows of march 2009. All these are between 5430 and 5400. So technically nifty might struggle to break below the 5400 levels and if it breaks successfully then hell would break loose on the market as it has all the possible chances of a vertical fall at-least towards 4950 levels. So 5400 appears to be a huge technical level for the nifty in the coming days or weak. Any longs can be held till that point only and no more than that.
Positives for Nifty:
§ Market is above 200 day EMA.
§ Market is above 50 day or 100 day EMA.
§ DMI has moved above 20 indicating strength of bulls.
§ Weekly MACD is in a buy mode.
Negatives for nifty:
§ The rise is on –ve divergences with MACD histogram and also RSI.
§ Daily MACD has given a sell signal
§ +D1 is moving down sharply and –D is moving up sharply indicating that bears are started to have upper hand.
Elliott wave:
In Feb-March I have indicated in my Elliott study that it would be difficult nifty to move above 5415 and 5585 and now one is violated and we have see whether the second one would be violated. This time it has failed to achieve the same.
Directional Momentum index – (DMI)
Currently +D1 is above –D1 and +D1 and +D1 has started to move down sharply and –D1 is moving up indicating the bears are gaining upper hand swiftly even the DMI has maintained at same level indicating neutral for the market.
M.Sri Mahidar
Sunday 8thAugust 2010, Time 19.16 IST
Trend is friend
Thursday, August 5, 2010

Wednesday, August 4, 2010


Tuesday, August 3, 2010


Monday, August 2, 2010


Sunday, August 1, 2010
Weekly technical Analysis for week ended 31st July 2010.
Nifty movement during the week is clearly indicating that bulls are finding extremely difficult to take the market further up. It appears that we might move down further then only move up if any. During this week nifty has formed 3 red candles and 2 white candles indicating that the bears are having upper hand during the week. Nifty has closed above 5400 during the earlier week and has failed to close above it in the immediately following week which is clearly indicating that 5400 is the formidable resistance and it is not easy for nifty to go past it at-least during the current rise. The failure to sustain above 5400 is a clear indicating the bulls do not have strength to take the market above 5400.
I have been mentioning over the past so many months that markets have been rising for around 9-10 weeks and have been falling for 5 weeks there after only exception being the last fall where the markets have fallen for 6 weeks. And this time also time taken to retrace the 6 weeks fall was nearly 8-9 weeks which happens to be more that the time take for the earlier fall. So it is clearly giving an indication that we are not going to runaway from the trading range of 4700-5400. So till the faster retracement of earlier rise or fall takes place we are not going to see a major move in either direction. So we have to keep a watch on the faster retracement for directional change in the market. I have been pointed during the last weeks update that it would not be easy for the market to go past 5400 and also decisive move above it as we have taken longer time to retrace the fall and it appears that we may be headed down wards as indicated at-least for the short term. As per time series analysis we have completed 10 weeks of rise and in the 10th weeks which was the last week we have started to move down, as per this we should further move down for at-least for another 4-5 weeks. So bulls better watch out.

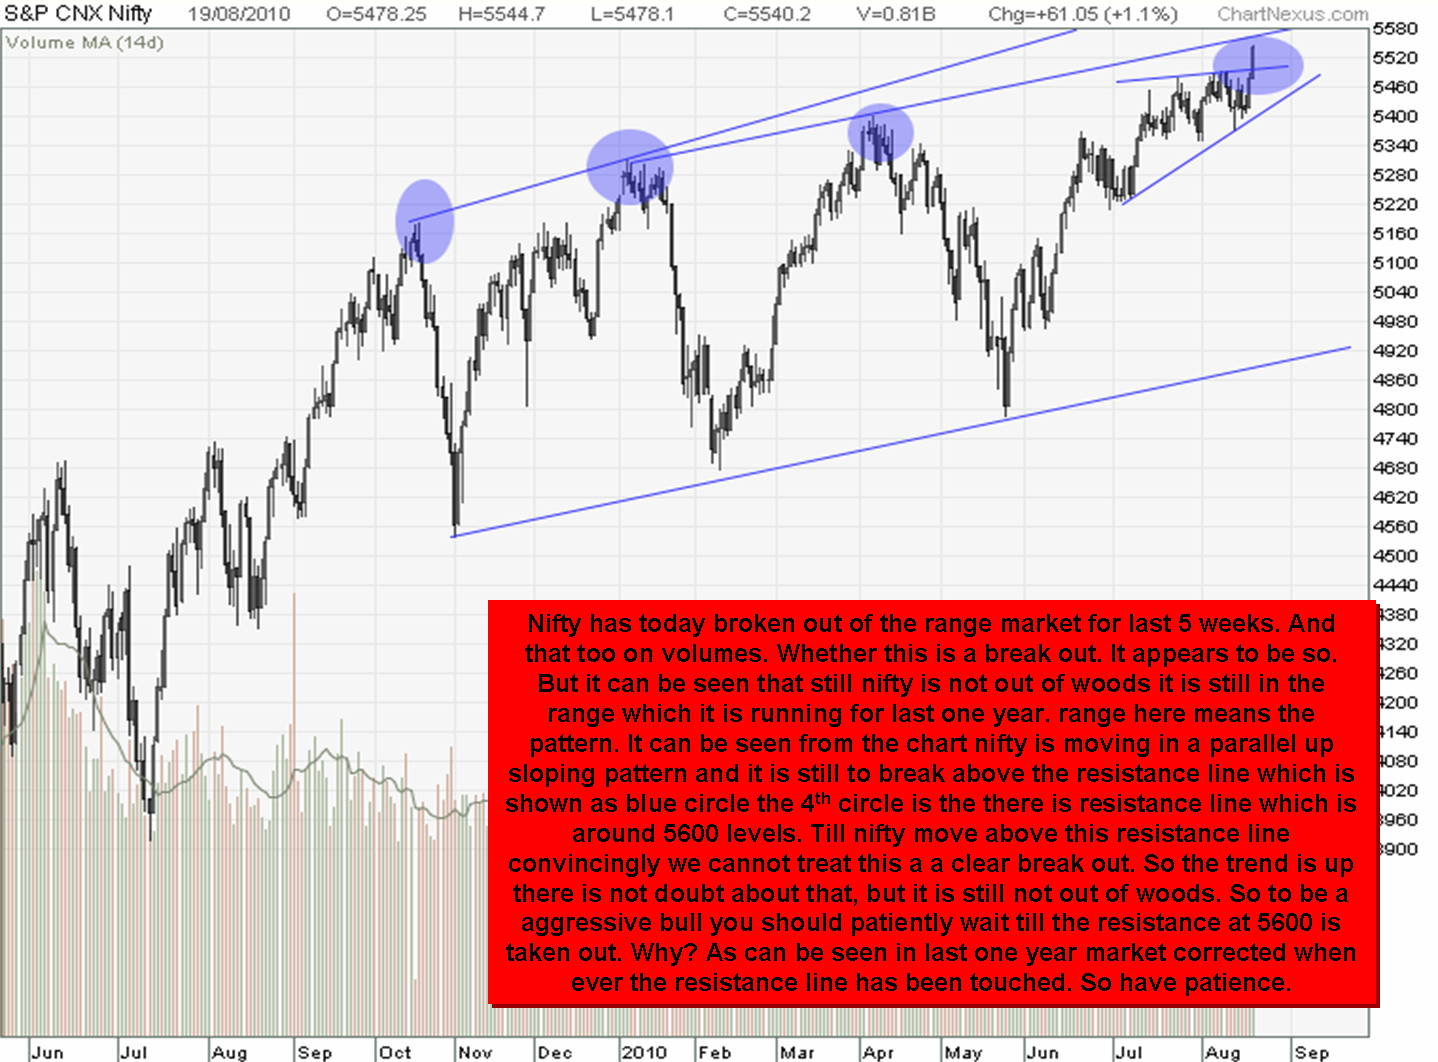
It can be seen from the above chart that nifty is trading in the range indicated by two parallel lines from that last nearly one year. And it has been forming higher tops and also higher bottoms which is clearly indicating that the trend is up. One of the point to be noted is that even though nifty is making a new high in each of the three raises indicated by arrows. It can be clearly seen in the parallel lines that the parallel line is sloping down and on each occasion the line is to be adjusted to down side. In each occasion the bulls are able to take the market to the new high but are failing to take it to the resistance levels. The distance between the original trend line and the new one are shown by double headed arrows in the circles. This is clearly giving an indication that even though bulls are taking market to new high they are failing to take it to the resistance indicating clearly that they lack strength.

It can be seen from the above chart that nifty has broke the one year trend line (blue line) and also the last 9 weeks trend line, both there are indicated in the white square on the left has side top of the chart. We can clearly see that nifty has broken below the nine week and also the one year trend line which is a clear weakness the market sentiment and if technicals are to be believed we should move towards the yellow line which happens to be the support line for last three occasions and this happens to be around 4950-4900 levels so nearly 400 points from the current levels. Will the market fall to these levels? Technically speaking the answer is yes.
 The above chart is of India VIX, it behaves inversely to that of the market. if the market moves up it moves down and when it moves down market moves up. It can be seen from the above chart that VIX has been moving in a expanding triangle pattern from nearly one year. Recently indicated by circles it can be seen that it has failed to moved towards the sloping support line which happens to be at 12. It may also be noted that while it is slowly sloping down forming lower lows the RSI of the same is forming higher lows i.e. positive divergence, which is clearly indication that we can see VIX reversing at any point of time. As it has failed to moved towards the support line at 12 we can easily see it moving upwards towards the resistance line which happens to be at around 35 levels very swiftly. So it is also indicating probable reversal of the trend in coming days.
Positives for Nifty:
§ Market is above 200 day EMA.
§ Market has moved 50 day or 100 day EMA.
§ DMI has moved above 20 indicating strength of bulls.
Negatives for nifty:
§ The rise is on –ve divergences with MACD histogram and also RSI.
§ Daily MACD has given a sell signal
§ Weekly MACD is about to give a sell signal immediately after giving a buy signal which is an indication of weakness
§ +D1 is moving down sharply and –D is moving up sharply indicating that bears are started to have upper hand.
§ DMI is also moving down.
Elliott wave:
In Feb-March I have indicated in my Elliott study that it would be difficult nifty to move above 5415 and 5585 and now one is violated and we have see whether the second one would be violated. This time it has failed to achieve the same.
Directional Momentum index – (DMI)
Currently +D1 is above –D1 and +D1 and +D1 has started to move down sharply and –D1 is moving up indicating the bears are gaining upper hand swiftly even the DMI is moving down it has moved from around 30 to 27 levels and is sloping down so indicates weakness.
M.Sri Mahidar
Sunday 1st August 2010, Time 19.31 IST
Trend is friend
Subscribe to:
Posts (Atom)