Tuesday, December 15, 2015


Nifty 7700/- As per the chart nifty is showing both bullish and bearish pattern. Nifty has taken support around 7500-550 levels two time over a period of three months which indicating some bullishness. So till 7500 is taken out decisively bears cannot be dominate. Another thing to be noted is that nifty has also formed H&S pattern and has broken the neck line taken support and approaching the neck line. will it be a H&S failure or not or will move further downward.IF H&S is confirmed that we can expect 600 points from 7700 a target of 7100 so wait and watch.
Mahiidar M
Enjoying Life
Trend is Friend.

Thursday, December 10, 2015

HDFC bank Rs.1060/- the stock has not corrected much we would see technically what its pointing towards. HDFC bank seems to have formed triple top over a period of last one year. See the three to four arrows which is indicating that the stock is finding it difficult to move past 1040 and thrice it has failed to pass over it so the upside as of now is limited/restricted. The stock has also finding support at 200 EMA. It appears that the stock is either poised for down wards or is stuck in range. Chances are on down side below 1000. IF 1000 is taken out then 850 would be the probable target.

Mahiidar M
Enjoying Life
Trend is friend.

Monday, December 7, 2015


Maruthi- Rs.4564/- Maruthi is forming a perfect topish pattern as raising triangle. Generally the break out would be in the opposite to the angle of the triangle. In this case the slope is upwards so we can expect the break out to be downwards. The breach of trend line would signal the confirmation of the pattern and its break down. So we have to patiently wait for the break down of the trend line. if the trend line is taken out the the pattern implications are pointing towards probable target of 4000 levels the move would be very swift to the surprise of every body.

Mahiidar M
Enjoying Life
Trend is Friend.

Nifty -7765/-. Nifty appears to be forming heads and shoulders as indicated in the chart above, the pattern is forming for last two and half months any breach of the neck line would propel it to lower levels. The neckline is at around 7700 levels. Any breach of the same would be disastrous for the bulls.The target as per the pattern comes 600 points from 7700 so the probable target comes to 7100. Will the neckline would be broken and 7100 would be achieved or not only time will tell but the neck line is important as of now.

Mahiidar M
Enjoying Life
Trend is Friend.

Tuesday, November 24, 2015

Petro Net - LNG- Rs.233/-, the stock has made an all time high and ATH stocks are my favorite stocks. the stock seems to have made an Heads and shoulders pattern over a period of 4 years and has just broken out of neck line and the volumes were also very high on break out, indicating that the trend might have turned up and indicating that it would move up on coming weeks or months. Its a fundamentally strong stock and break out with fundamental background is a good for bulls. So the stock is giving a bull strength.Stop loss below 170/-
Mahiidar M
Enjoying Life
Trend is Friend.

Monday, November 23, 2015

Nifty -7849/- whether nifty is poised to move substantially from current levels? it does not appear to be so technically. There are so many negative things in nifty first its below 200 day EMA which itself is a bearish signal and there is also golden cross, 50 day and 100 day EMA have moved below 200 day EMA which is regarded a very bearish signal. Also the distance between them is increasing which is an indication that we might move down wards, there might be slight up moves but ultimately move down. So as far as technicals are considered its pointing downward movement and it appears it might accelerate in coming week/s.

Mahiidar M
Enjoying Life
Trend is Friend.

Sunday, November 22, 2015

Bata India-Rs.491/- this stock has been in an uptrend for last five to six years. Now we have to see whether there is still steam left in the stock or not. As of now technically it seems that the uptrend might have been over and the stock might move down wards in weeks to come unless and other wise it moves above 620/-. The stock has moved below 200 week EMA which is a very bearish signal, this even has occurred for the first time after June 2009 so we cannot ignore the same. So the stock has all chances of moving downwards. if it moves above 200 week EMA, bears will hv to wait till it moves  below it so below 487 the stock can go up to 350 levels.
Mahiidar M
Enjoying Life
Trend is Friend.

Sunday, November 15, 2015


Page Industries Limited: 12135/- The stock has been a multi bagger for last six years it has risen from around 300 levels to around 17000 levels giving a return of 56x . But now the stock has moved below 200 day EMA for the first time after 2009 which is a bearish indication. The break of 200 day EMA is also co-in sided with break of trend line drawn from the low of 2009 which is gives us a double bearish sign.The stock has taken support at 200 EMA then move up and made lower high and then made a lower low which co-insided with both break of 200 day EMA and also trend line. all these point towards bearish days for the stock and it appear that it might easily move below 10000 level towards its 52 week low of around 9000 as of now. So technically it seems to be bearish weeks or months for the stock, unless and other wise the 200 day EMA is conquered but it appears to be a remote chance as of now. 
Mahiidar M
Enjoying Life
Trend is Friend.
Grasim Limited-Rs.3623/- the stock is finding extremely difficult to move past the high of 2007 which is around 4000. It has tried to move above it and for last 12 months its finding difficult to move above it. so till That high is taken out we cannot expect to be trending on upside so bulls can rule only above 4000 till that time we can expect a side ways movements or down side. So till 4000 is taken on weekly basis that too on volumes we cannot expect much for bulls.

Mahiidar M
Enjoying Life
Trend is Friend.

Tuesday, November 10, 2015

AIA Engineering Rs.933/- the stock has been on a continues uptrend for last two years and now seems to be correcting. it has been above 200 day EMA for all these years and now it has moved below 200 day EMA and has been finding resistance at the same. 200 day EMA has offered resistance three times in last six months indicated by arrows. As is the rule below 200 day EMA bears rule and above it bulls rule. So as it is offering resistance we can expect the stock to correct heavily in coming weeks or months. So till the stock closes above 200 day EMA decisively, we can expect bears to dominate stock.

Mahiidar M
Enjoying Life
Trend is Friend.

Saturday, November 7, 2015


Adani Ports - Rs.285/- the stock has been in an uptrend for last two years. We have to see whether the trend is intact or not. It can be seen in the chart that for last six months, the stock is in a range and notice the volumes during the ranging market they were high, which is a clear indication that a good amount of distribution has been done and further upsides in the stock are very difficult. The stock has broken out of the range and the break down has been on volumes, so we can expect further down sides. Unless and other wise the range is conquered we can expect the stock to come down. Technically it has chances of falling to around 180 levels so will it go there only time will tell but technicals are pointing towards that.

Mahiidar M
Enjoying Life
Trend is Friend.

Bharti Airtel- this stock has been in a range between Rs.250 to Rs.500 for last six years, It has been oscillating in this range for last six years. So as far as bulls and bears are considered nothing can be expected till the range is taken out, so We have to wait for 250 to buy and sell at 500, any breach of 500 on weekly or monthly charts then we can expect the stock to make very good advance from those levels. So till then its better a stock to be avoided for investment purpose.

Mahiidar M
Enjoying Life
Trend is Friend.

Ajanta Pharma - Is one stock which has been continually rising from last six years it has risen from Rs.10 in 2009 to around Rs.1700/- levels, a rise of 170x we now see whether the stock is poised for further up move or it on topish formation. During the last six years the stock has not moved below 200 day EMA, after a very long time it has formed a lower high and now its on verge of formation of lower low which confirms that culmination of the current up move. till a new high is made we cannot expect a much action in the stock on upside. Now the thing to be watched is the 200 day EMA which happens to be around 1364 levels, this is the point to be closely watched. Any close below 200 day EMA on weekly basis would confirm the larger correction than that witnessed in last 6 years. So bears are slowly creeping into the stock.

Mahiidar M
Enjoying Life
Trend is Friend.

Thursday, November 5, 2015

Sun-pharma- One week back i have indicated that sun pharma is on the verge of a break of 15 years trend line and now it seems to have decisively broken the same. As the trend line is for very long term we can expect a bigger correction which has not be anticipated. Another point to be noted is that at the top the pattern formation is also bearish. it seems to be clearly forming H&S pattern over last one year and is on verge of breaking the neck line. The neck line is around 800 levels, so if 800 is breached decisively then H&S pattern implication give a target of around 450 levels will it go there only market would tell. It seems that the long term uptrend seems to be over in sun pharma and it is not going to be a bull market in it.

Mahiidar M
Enjoying Life
Trend is Friend.


Bank Nifty, also seems to be in similar pattern and we seems to have started the down move which is going to be very violent. In coming weeks it seems to be heading downwards and bears are going to rule this index also. It has chances of going to 14000 levels which happens to be nearly 3000 points from current levels.

Mahiidar M
Enjoying Life
Trend is Friend.

Nifty is forming a very bearish pattern and it is clearly indicating that in coming weeks we might be in for a very bearish move. Nifty seems to be forming an expanding triangle and we seems to have completed the wave-4 and we have just started the wave-5, and generally it is the one which is most violent and also most destructive. Now we have to see the volumes and the volumes would be very high during the formation of the move and it would be most destructive of all the waves both time wise and also price wise. if the formation is correct then the fifth wave would all the way go and move beyond the 1-3 trend line i a big way so we can easily see it below 7000 levels and towards the 200 week EMA which happens to be at 6700 levels. Will it go there the pattern implication are pointing towards that. This pattern nearly similar to the pattern formed in Jan to Sep 2008, and we know the effect of the same. This would i would try to explain in the coming week. So the pattern is indicating that the bears are going to rule the market in coming weeks or months.
Mahiidar M
Enjoying Life
Trend is Friend.


Tuesday, November 3, 2015


CNX mid cap index is finding it difficult to move above its 2008 high of 6050. it has tried three times during last one year and all the times it has failed to make a new high this indicates that till decisive new high is made mid cap index will not go any where. Only one concern here is during the consolidation generally volumes would be less and on break out the volumes increases. But in this case the volumes are high during consolidation which is rare. So we have to see how it behaves but any breach of 5000 would spell doom for bulls and we can expect healthy correction in the index and also underlying stocks.So bulls have to wait for some time to dominate.

Mahiidar M
Enjoying Life
Trend is Friend.
CNX-100 is forming lower highs and lower lows after 2012 on wards. This index has fomed lower lows only once but has not formed lower highs. So after long time this pattern has been formed which is clearly indicating that the index has become week and we can expect larger correction in coming weeks unless and other wise higher highs and higher lows are formed so till then bears are having upper hand.

Mahiidar M
Enjoying Life
Trend is Friend.

Monday, November 2, 2015


Indusind bank is in a continues uptrend from last six years i has moved from around 30 levels to current levels of around Rs.950/-. it is struggling to move and close above 950 levels it has made three attempts and in each attempts it has failed to move above it. The each rise post first correction was on high volumes but the those volumes failed to take it to new high which is a clear indication that the stock is in top formation and it would not move up in a hurry. it seems to have clearly formed a triple top show by three arrows. So indus ind bank is not a buy as of now we, it appears that it might end up on moving down. Any breach of 800 would confirm it and then it has all chances of moving towards 500, till then we have to keep a close watch bulls be carefull.
Mahiidar M
Enjoying Life
Trend is Friend.

TCS, seems to be stuck between a range of 2800 to 2400 from last one year onwards. This is clear indication that TCS is a stock not to be entered into within the range. only long to be take when the weekly close above 2800, and any breach of 2400 would trigger bears and the stock can fall below 2000 levels easily. But one thing to be noted is that during the side ways market during last one year the volumes have not decreased and in fact they are slightly heavy indicating that some amount of churning is happening but long consolidation is some concern for bears. So as of not TCS is a stock to be watched rather than invest.

Mahiidar M
Enjoying Life
Trend is Friend.

Thursday, October 29, 2015

Sunpharma has been in a continues uprise from last 20 years on-wards so we would look at the chart to see what technicals are indicating. This is also same as in case of others the volumes are heavy at top it fell on heavy volumes then the volumes were heavy but these volumes failed to take it above the all time high indicating that some informed investors might have got out of the stock and we might see it finding difficult to make a new high.Notice also the trend line where the stock has been finding support for last one decade and now again it is at the trend line whether it takes support at this level or not only time would tell. but the heavy volumes are indicating that it might break the same. Sun-pharma has not made a lower low for last 20 years and if now it moves below 800 it would form lower low which would indicate that the top might have been in place as of now. it would also break the 10 year trend line. so wait patiently as we might see a down trend in stock after multi decade up move.

Mahiidar M
Enjoying Life
Trend is Friend.
for last five years Pharma stocks have been the darling of the market. So now we see what technically what it is indicating. Technically the the index appears to be indicating a toppish signal. if you notice the first fall it has been on very heavy volumes indicating the some major investors are not interested  and post that, the rise has been on good heavy volumes by till now it was not able to make a new high which is an indication that pharma index might have topped out and we might be reversing in coming weeks or months. Whether long term top has been made we have to see the individual stocks, it on seeing the technicals indicating the the up move might have been over. Pharma index seems to be in process of forming a topping head and shoulder pattern it appears to be in forming the final right candle and any breach of 12000 would confirm the same giving a target of 9000 so pharma up move seems to be waning.

Mahiidar M
Enjoying Life
Trend is Friend.

Wednesday, October 28, 2015

Darling of the investors over period of last two years Maruti Udyog limited. It has risen from around Rs.1000 levels to around Rs.4700 during last two to three years. The techncials are indicating that the up move might be maturing and it might turn down in coming weeks it has till a new high is made we can expect that the stock is headed down wards. It made a high of 4700 in august 2015 and then fell 4100 levels and then has risen again to 4700 levels, here the perfect technical top formation is indicated by volumes. the rise from 4100 to 4700 has highest volumes( highest in rise from 1000 to 4700) and this highest volumes have failed to take it upwards or a new high and sustain there which is a classical double top. The highest volumes suggest that the informed investors have got out of the stock in the last rise and they have now much interest in the stock. So now till 4700 is successfully taken out and sustained above it we can expect maruti might have topped out and we can expect it to to move towards 3800 and then 3200 levels will it go there? if 4700 is not taken out we can expect it to atleast correct it to 3800 but the best would be 3200. 
Mahiidar M
Enjoying Life
Trend is Friend.

Nifty seems to be heading lower considering the technicals.Nifty is below 200 day EMA and also SMA which is a bearish indication. This is the longest time after 2011 where nifty is below 200 EMA/SMA. It may also be seen that 200 EMA(black MA) is below 200 SMA(red MA) which is also a barish signal. nifty moved below 200 EMA by gap down in august and then made a low of 7550 and then reversed again to move above 200 EMA and found resistance at SMA and then moved down wards and that too today with gap down below 200 EMA which is also a bearish signal. All these are pointing technically that bulls are not going to have a good days in comming weeks or months. So till 200 day EMA/SMA are not taken out we can easily see nifty making new low.
Mahiidar M
Enjoying Life
Trend is Friend.

Thursday, July 23, 2015

Granules:Rs.102

Granules has made an all time high after nearly 10 months of consolidation the break out is on huge volumes indicating that some informed buying has gone into the stock. it has taken Support exactly at 200 day EMA and then bounced generally above 200 day EMA bulls are active.Fundamentally the company has been working really good and the profitability has been continually increasing over last 10 years indicating that the rise is on strong and improving fundamentals. I wish to put stop loss at 200 day EMA as of now.
Mahiidar M
Enjoying Life
Trend is Friend.
Indian Oil Corporation:Rs.454

IOC has made all time high just now and notice the volumes on the break out move which is huge indicating that huge amount of informed buying has gone into the stock. Bulls seems to be active in the stock. I have kept a stop loss at Rs.375/-

Mahiidar M
Enjoying Life
Trend is Friend.

Sunday, June 21, 2015


Weekly technical Analysis for week ended 20th June 2015.
Nifty opened on slightly weak note then onwards it started to move up and was in continues uptrend for the last five days  and one noticing feature of the up move was that all the candles were green candles indicating that bulls are trying all means to take the market up. This week they did not give bears any chance to fight back. So can we consider that the down move is over and we can expect the market to make a new high? The answer appears to be no. it can become yes only when nifty move above 8500 in next two days which seems to be difficult. One positive thing for bulls which has happed on Friday was that nifty was able to move above 200 day EMA and sustain there for whole day we have to see whether market would be able to sustain above it for the whole week to indicate strength.


It can be seen from the above that nifty has been finding resistance at 50 day and 100 day EMA indicated by red arrows for the last three months and unless and otherwise both are taken out decisively we cannot say that the trend has reversed. Another point to be noted is that nifty is making lower lows and lower highs shown by black arrows. Till that is being maintained we can expect the market the market to drift down wards. 

Another point to be noted is that the re-tracement of the fall is taking longer time indicating that the bulls are not as strong as it appears to be that is the reason I have indicated earlier that we have to move past 8500 in next two days. So if we do-not move past that level in next two days we can easily expect the market to at-least test the bottom or move below it.  So still technical parameters are indicating that the market is in down trend and has all chances of continuing the trend in coming weeks. So be cautious with the current up move as it can reverse at any point of time.

Mahiidar M
Enjoying Life
Trend is Friend.

Monday, June 15, 2015

Point and figure chart is clearly indicating that central bank is in for a healthy fall. Central bank has broken the buying level at around 102 levels. This clearly indicates that central bank has entered a selling area and we can expect a healthy fall in the stock atleast 20 to 30% from current levels till 102 is not conquered.
So better watch out

Sunday, June 14, 2015


Weekly technical Analysis for week ended 13th June 2015.
During the week Nifty has opened at 8124 made a high of 8163, made a low of 7940 and closed at 7982 virtually at the low of the weak. This is an indication of weakness in the market. On Daily charts nifty has closed below 8000 which is a bearish signal for the bulls. Off late 8000 was acting as a formidable support, buying pressure was coming when nifty but this time bulls seems to have not offered much support. Weekly close below the 8000 level is a bearish indication for bulls. In the next week nifty has to conquer 8000 other wise there should be a violent fall in the market. Nifty has also moved below 200 day EMA move up and found resistance at the same levels and then started to fall, giving a perfect technical support. 8200 is the 200 day EMA below it bears are going to rule the market, it is the level which the long term investors would be looking at. Another point to be noted is that 20 day EMA has moved below 200 day EMA which has happed for the first time after September 2013 which is also a bearish indication for the market.
Another point to be noted is that nifty has moved below 50 week EMA for the first time after September 2013 which is also a bearish indication. 50 week EMA is at 8124 and the high of the week is at that levels only so nifty has to moved it to offer any strength to the bulls otherwise we can expect worst for the market. If history is to be see some bad weeks or months can be expected for the market. You might be wondering what is it, during the last 10 years whenever the nifty has moved below 50 day EMA and sustained it has all the way went down and moved below or found support at 200 week EMA. 200 day EMA is at around 6700 levels, so if nifty fails to conquer 8130 we can surely expect it to move towards 6700 levels which happen to be 20% from current levels so we can easily expect the same levels. Even FIIs are not in a buying mode in last one to one and half month. All these are pointing towards bearish market in coming months. So brace for the same unless and other wise market successfully move above 200 day EMA so we have to keep a close watch at 8200 levels.
As have indicated in earlier update nifty has formed H&S pattern and any breach of neck line would give a target of 6700 levels for the nifty. And this week nifty has broken below the neck line and if nifty sustains below it then we can expect the target to ne achieved.
It May be noted that more that 60% of the nifty stocks are quoting below 200 day EMA and most of the other stocks are also around 200 day EMA only pointing towards possible down side for the market. So brace for the same.
Mahiidar M
Enjoying Life
Trend is Friend.

Monday, June 8, 2015


Technical Analysis of Market

My charting software has some problem and not opening where i have all my studies that why any updates are not posted i am posting this update as market is at very critical level i.e. make or break level.

Nifty has been showing signs of weakness from last so many weeks. It has been making lower lows and lower high which is clearly an indication of weakness. Whenever we see intra day movement in nifty when ever any up move comes it is being met immediately by sellers which is clearly indicating that bears are becoming strong day by day and bulls are trying every ammunition in their arsenal to check mate bears and so far has not been successful, once the resistance is broken decisively then we can expect a violent fall in the market.
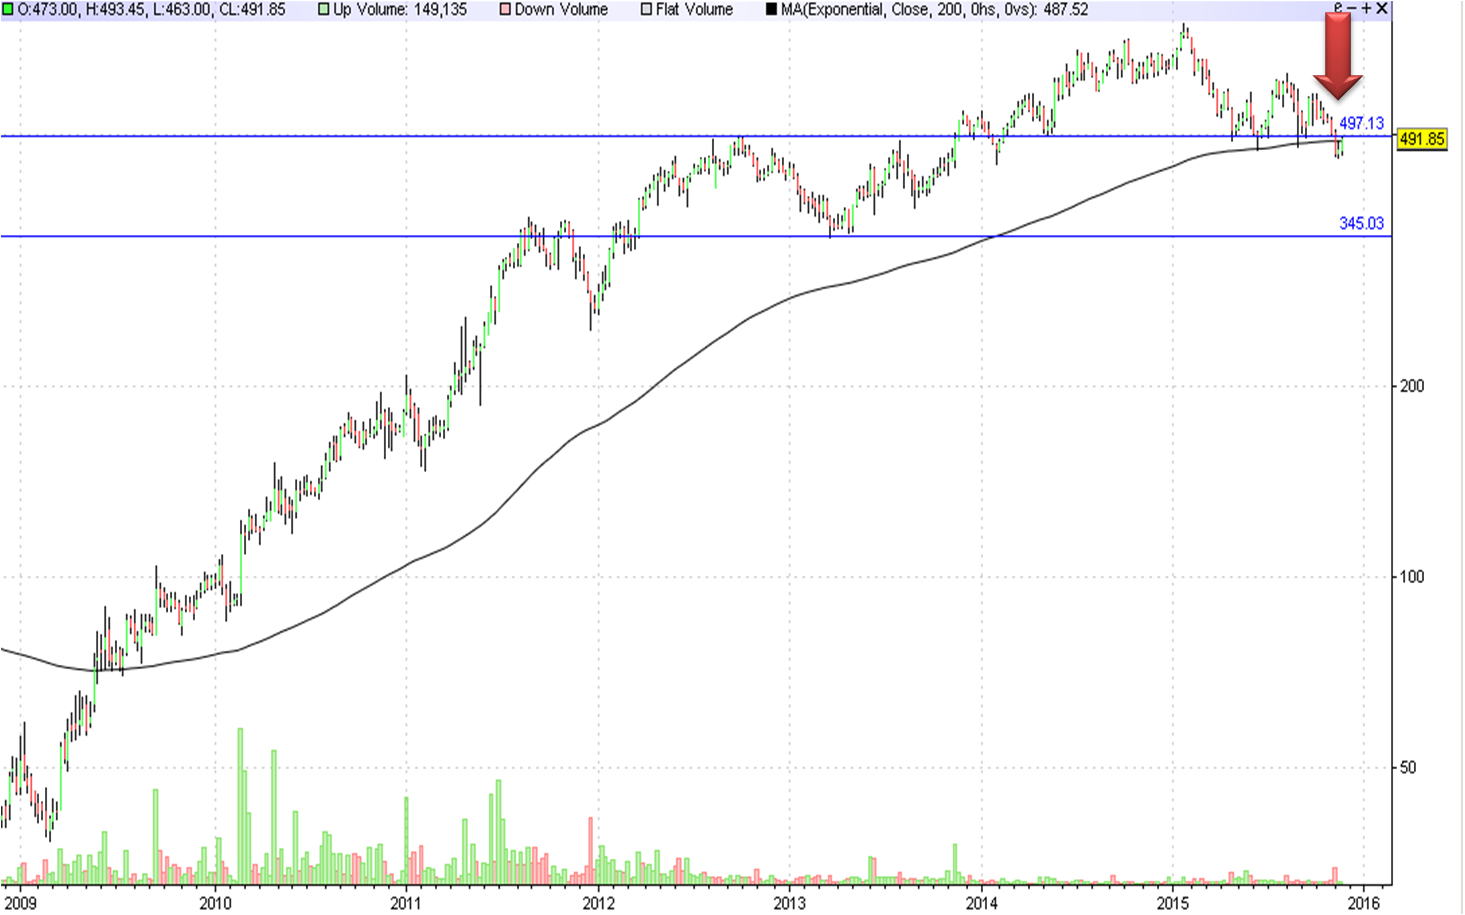
Nifty has moved below 200 day EMA in may 2015 and then went up and faced resistance at 50 day and 100 day EMA and then started to move down and again moved below 200 day EMA. The resistance offered by 100 day and 50 day EMA is clearly a sign of weakness. So now nifty has to move above first 200 day EMA and then 100 and 50 day EMA to indicate any strength. Nifty has moved below 200 day EMA twice in 30 days which has happened in august 2013 and in 2012 which is clearly an indication that we might be seeing weakness which has not been seen in last one and half to two years. Another sign of weakness is 50 day EMA has moved below 100 day EMA and the distance between them is slowly increasing indicating that the pace of fall is going to increase in coming weeks unless and other wise bulls stage a spectacular fight back.

Nifty has formed one H&S pattern and the second one is on the verge of completion.

First H&S pattern


As can be seen from the above nifty has formed an H&S pattern broke below the neck line in last week of april and then moved up and exactly found resistance at the neck line and started to move down and is moving down which is a perfectly H&S pattern set up and the minimum target comes to around 7500 levels nearly 600 points from current levels will it go there it seems to be.

Now we see the second H&S pattern.


As can be seen above that nifty is forming a H&S Pattern and is on the verge of breaking the neck line. The neck line is at 8000 which has offered support two time earlier and we have to see if the same offers support now also. If the neck line is taken out the we can expect a violent fall towards first 7500 and then to around 6700-6800 levels. So it seems that 8000 is the make and break for nifty as it just near it we should be very carefully watch the same any breach of same would be party for bears.

Mahiidar M
Enjoying Life
Trend is Friend.