
Wednesday, April 27, 2011
Monday, April 18, 2011

Sunday, April 17, 2011
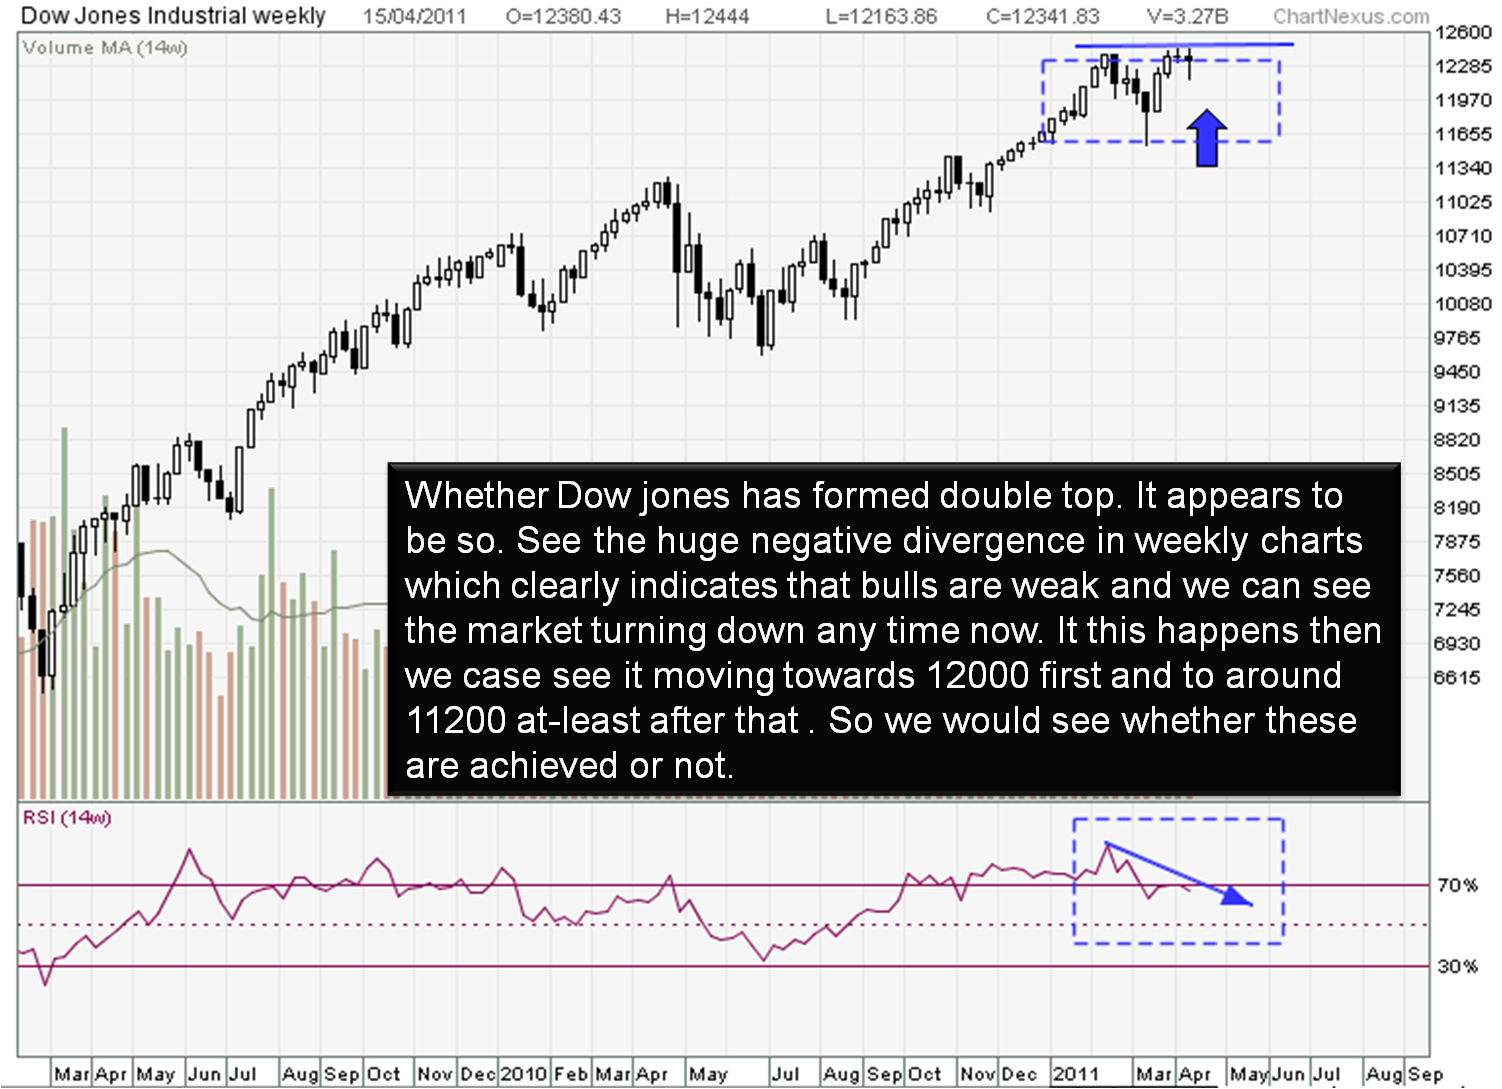
Weekly technical Analysis for week ended 16th April 2011.
This week was a truncated week, and not much seems to have happened during the week technically. On Monday the market was weak on Wednesday it made a spectacular recovery and on Friday again it corrected and closed in red. Only the rise on Wednesday made bears runs for shelter. The market is still above all the moving averages indicating that bulls are still in control of the market. One of the positive things is that nifty has take support at the 15 day EMA and reversed with vengeance from there so it appears as of now 15 day EMA is offering good support and till the market is above it the bulls would be having last laugh.15 day EMA is at 5782 so till it is above it bulls can have a party. But the movement on Friday appears to be somewhat worry some as it is just followed by a big bull candle of current year. The volume on Wednesday, the day of the big bull candle were not so encouraging. Generally the volumes would be very high during those days but that is not the case now. We have to see whether the market would maintain or tank. Please see in the Elliott wave update for any details.
Positive for the market:
- Nifty is trading above 50 day, 100 day and 200 Day EMA.
- Daily MACD is in buy mode but in the process of giving a sell signal. ·
- There is a divergence in MACD histogram. ·
- Weekly MACD has give a buy signal
negatives developing: ·
- Daily stochastic oscillator has given sell signal and is moving down.
- 50 day EMA is still trading below 200 day EMA indicating weakness.
- Monthly MACD is in sell mode indicating weakness in the market.
Elliott wave analysis:

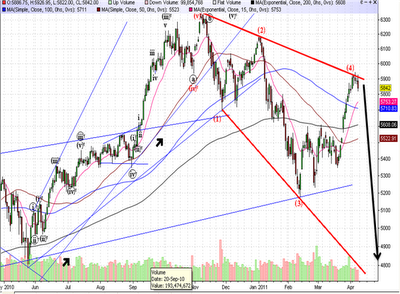
Generally Elliott wave give a clear picture when there is uncertainty, and Elliotte is giving the same. In previous weeks I have indicated that we might be forming an expanding triangle and we are in formation of the fourth wave and after completion of the same we can see fifth wave developing which would take the market down very swiftly and it would be very violent and also the longest of all the waves. The longest wave till now is of length 1000 points so the fifth wave would be of at-least 1000 length so we have to prepare for the same. The pattern is similar to that has been formed in January to may 2004 which is given below:

You see the fifth wave which is from around 1900 to around 1300 levels that have been the longest and the most volatile. Whether the same would happen now we have to wait and watch. Generally in an expanding triangle very body gets bullish on completion of the fourth wave and then the market suddenly turns the same seems to be happening now and the same was in April 2004 so we have to see whether the same happens now or not. Just wait and watch.
Wolf wave:
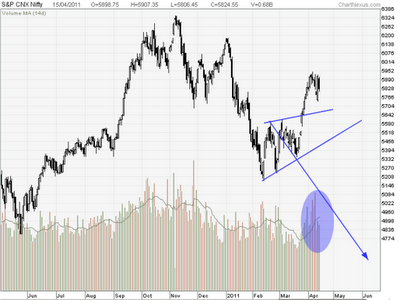
Nifty seems to have formed a wolf wave over a period of last two months. The volumes are also suggesting the same. As in WW the volumes would be very high in the formation of the fifth wave and the same appears to have happened. So any close below 5700 would confirm the same, then the target comes to be around 4700-4800. Whether the targets would be met or not only market would tell. So patiently wait for nifty to close below 5700. So keep a close watch.
M.Sri Mahidar
Trend is Friend.
Sunday, April 17th 19.50 IST
Monday, April 11, 2011
Nifty Weekly Update
Weekly technical Analysis for week ended 9th April 2011.
Movement of nifty during the week was indicating the it has tired of rising and is indicating weakness. The weekly candle is clearly indicating weakness. Unless and otherwise the high of this is taken out in the first two days we can see nifty drifting downwards at-least towards 5600 levels. nifty is still maintain above all the moving averages indicating that the bulls are in upper hand and we have to see whether the same would continue for some more weeks or not. But for the time being nifty is indicating weakness and we might slowly drift down. The only good news for bulls is that the volumes during the week were less and this week the market did not move anywhere so now we have to closely watch the volumes whether it moves up or down. Elliott wave is giving a good indication of the future movement and that would be discussed at appropriate place.
Positive for the market:
- Nifty is trading below 50 day, 100 day and 200 Day EMA.
- Daily MACD is in buy mode.
- Weekly MACD has give a buy signal
negatives developing:
- Daily stochastic oscillator has given sell signal and is moving down.
- 50 day EMA is still trading below 200 day EMA indicating weakness.
- Monthly MACD has given a sell signal indicating extreme weakness in the market.
Elliott wave analysis: Generally Elliott wave give a clear picture when there is uncertainty, and Elliotte is giving the same. Last week I have indicated that we might be forming an expanding triangle and we are in formation of the fourth wave and after completion of the same we can see fifth wave developing which would take the market down very swiftly and it would be very violent and also the longest of all the waves. The longest wave till now is of length 1000 points so the fifth wave would be of at-least 1000 length so we have to prepare for the same.
The pattern is similar to that has been formed in January to may 2004 which is given below:

You see the fifth wave which is from around 1900 to around 1300 levels that have been the longest and the most volatile. Whether the same would happen now we have to wait and watch. Generally in an expanding triangle very body gets bullish on completion of the fourth wave and then the market suddenly turns the same seems to be happening now and the same was in April 2004 so we have to see whether the same happens now or not. Just wait and watch.
M.Sri Mahidar
Trend is Friend.
Sunday, April 10th 19.36 IST
Sunday, April 10, 2011
Weekly Update
Weekly technical Analysis for week ended 9th April 2011.
Movement of nifty during the week was indicating the it has tired of rising and is indicating weakness. The weekly candle is clearly indicating weakness. Unless and otherwise the high of this is taken out in the first two days we can see nifty drifting downwards at-least towards 5600 levels. nifty is still maintain above all the moving averages indicating that the bulls are in upper hand and we have to see whether the same would continue for some more weeks or not. But for the time being nifty is indicating weakness and we might slowly drift down. The only good news for bulls is that the volumes during the week were less and this week the market did not move anywhere so now we have to closely watch the volumes whether it moves up or down. Elliott wave is giving a good indication of the future movement and that would be discussed at appropriate place. Positive for the market: · Nifty is trading below 50 day, 100 day and 200 Day EMA. · Daily MACD is in buy mode. · Weekly MACD has give a buy signal negatives developing: · Daily stochastic oscillator has given sell signal and is moving down. · 50 day EMA is still trading below 200 day EMA indicating weakness. · Monthly MACD has given a sell signal indicating extreme weakness in the market.
Elliott wave analysis:  Generally Elliott wave give a clear picture when there is uncertainty, and Elliotte is giving the same. Last week I have indicated that we might be forming an expanding triangle and we are in formation of the fourth wave and after completion of the same we can see fifth wave developing which would take the market down very swiftly and it would be very violent and also the longest of all the waves. The longest wave till now is of length 1000 points so the fifth wave would be of at-least 1000 length so we have to prepare for the same.
Generally Elliott wave give a clear picture when there is uncertainty, and Elliotte is giving the same. Last week I have indicated that we might be forming an expanding triangle and we are in formation of the fourth wave and after completion of the same we can see fifth wave developing which would take the market down very swiftly and it would be very violent and also the longest of all the waves. The longest wave till now is of length 1000 points so the fifth wave would be of at-least 1000 length so we have to prepare for the same. The pattern is similar to that has been formed in January to may 2004 which is given below:  You see the fifth wave which is from around 1900 to around 1300 levels that have been the longest and the most volatile. Whether the same would happen now we have to wait and watch. Generally in an expanding triangle very body gets bullish on completion of the fourth wave and then the market suddenly turns the same seems to be happening now and the same was in April 2004 so we have to see whether the same happens now or not. Just wait and watch.
You see the fifth wave which is from around 1900 to around 1300 levels that have been the longest and the most volatile. Whether the same would happen now we have to wait and watch. Generally in an expanding triangle very body gets bullish on completion of the fourth wave and then the market suddenly turns the same seems to be happening now and the same was in April 2004 so we have to see whether the same happens now or not. Just wait and watch. M.Sri Mahidar
Trend is Friend.
Sunday, April 10th 19.36 IST
Monday, April 4, 2011
Nifty weekly
Weekly technical Analysis for week ended 2nd April 2011.
Nifty opened on a strong note and continued to move up whole during the day indicting the strength of the bulls. From the last two weeks onwards bulls have been dominating the market. The bulls have take the bears by surprise and are continuing to surprise them. One of the positive features of the of the current movement is that nifty has moved above all the three major moving averages, 50 day 200 day and 100 day EMA and is staying above them indicating strength of the bulls. Previously it was finding resistance at the 100 day EMA 200 day EMA at-least thrice and this time has moved above them without any difficulty which is clearly indicating the bulls are here with a purpose. Another positive feature which is in favor of bulls is the Daily MACD has given a buy signal and market has started to move up after that and it has moved above the trigger line i.e above the 50 line and is continuing to rise and also the distance between the trigger line and MACD is increasing indicating the bulls are gaining strength and they has all chances of taking the market further up.s Positive for the market: · Nifty is trading below 50 day, 100 day and 200 Day EMA. · Daily MACD is in buy mode. · Weekly MACD is about to give a buy signal and if that happens then bulls would be further strengthened. · Daily Stochastic oscillator is about to give a sell signal negatives developing: · Weekly MACD is in sell mode indicating weakness in the market and also every rise would be sold into. · Weekly Stochastic oscillator has just give a buy signal · 50 day EMA is still trading below 200 day EMA indicating weakness. · Monthly MACD has given a sell signal indicating extreme weakness in the market.
Elliott wave analysis: Generally Elliott wave give a clear picture when there is uncertainty, and Elliotte is giving the same. I have indicated in my Elliott wave updates that any close above 5700 would negate my wave count given earlier we have to see for alternative structure. Nifty has moved above 5700 comfortably and is place at around 5900 comfortably. Now we have to see for alternative structure. Here wave-4 has moved into the area of wave-1 in case of lower and also higher wave structure, which give an indicating that the wave structure selected by me was wrong. The wave-4 goes into the area of wave-1 in case of a triangle whether expanding or contracting triangle. In the present case it appears that we might be forming an expanding triangle. The wave structure formation is given below

It can be seen in the above chart that we are in formation of an expanding triangle and it seems that we are in formation of fourth wave. In the triangular pattern we have only five waves and the case of expanding triangular pattern the fifth wave would be move violent and would be the longest of all the waves and would be in the Fibonacci relations with the previous longest waves. So the longest wave till now appears to be 1000 points so we can see Fibonacci relations with that and it would be more than 1000 points from the completion of the fourth wave. Generally the fifth wave in the expanding triangle would the longest and the more swift and would surprise everybody that means that everybody would be caught unawares. So it appears that the fourth wave should complete around 5900-6000 levels it appears that we are nearing the completion of the fourth wave whether we would start the down move in time to come or not only time would tell. Bulls should be care full at the present as we are nearing the completion of the fourth wave. So we have to see whether the pattern is confirmed or not. if the market moves up without correcting then we have to change the entire structure and it becomes a very very bullish pattern. But now we have to see what enfolds. The pattern is similar to that has been formed in January to may 2004 which is given below: 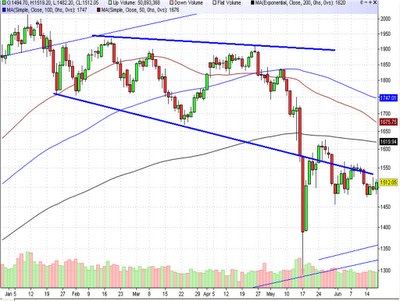 You see the fifth wave which is from around 1900 to around 1300 levels that have been the longest and the most volatile. Whether the same would happen now we have to wait and watch. Generally in an expanding triangle very body gets bullish on completion of the fourth wave and then the market suddenly turns the same seems to be happening now and the same was in april 2004 so we have to see whether the same happens now or not. just wait and watch.
You see the fifth wave which is from around 1900 to around 1300 levels that have been the longest and the most volatile. Whether the same would happen now we have to wait and watch. Generally in an expanding triangle very body gets bullish on completion of the fourth wave and then the market suddenly turns the same seems to be happening now and the same was in april 2004 so we have to see whether the same happens now or not. just wait and watch. M.Sri Mahidar
Trend is Friend.
Monday, April 4th 20.17 IST
Subscribe to:
Posts (Atom)