Weekly technical Analysis for week ended 28st January 2012.
The movement during the week has been one of the longest journey for bulls in last one and half year so we cannot just ignore the move. There are only two things possible as of now as this is the last desperate attempt of the bulls to decimate bears or start of a new bull run. Only time would tell which it is. So we have to wait for the same. So now the question comes why the market has risen so viciously in the current period. A major elliotte wave has completed at around 4600 levels and the journey is indicating that we are in for a good up move and that is unfolding. Actually I have missed the actual completion as I have seen historically that in January the trend is down and expected the down trend to continue with wave extension.So whether the trend has turned up and down trend is over. As per my analysis its not as the Wave structure as per my analysis seems to be not over. But what actually comes I have to update it if proven wrong. As my motto always is price is king. When ever I ignore the market reminds me this I am wrong. This time I have ignored it and market has just slapped me and said that I am wrong.
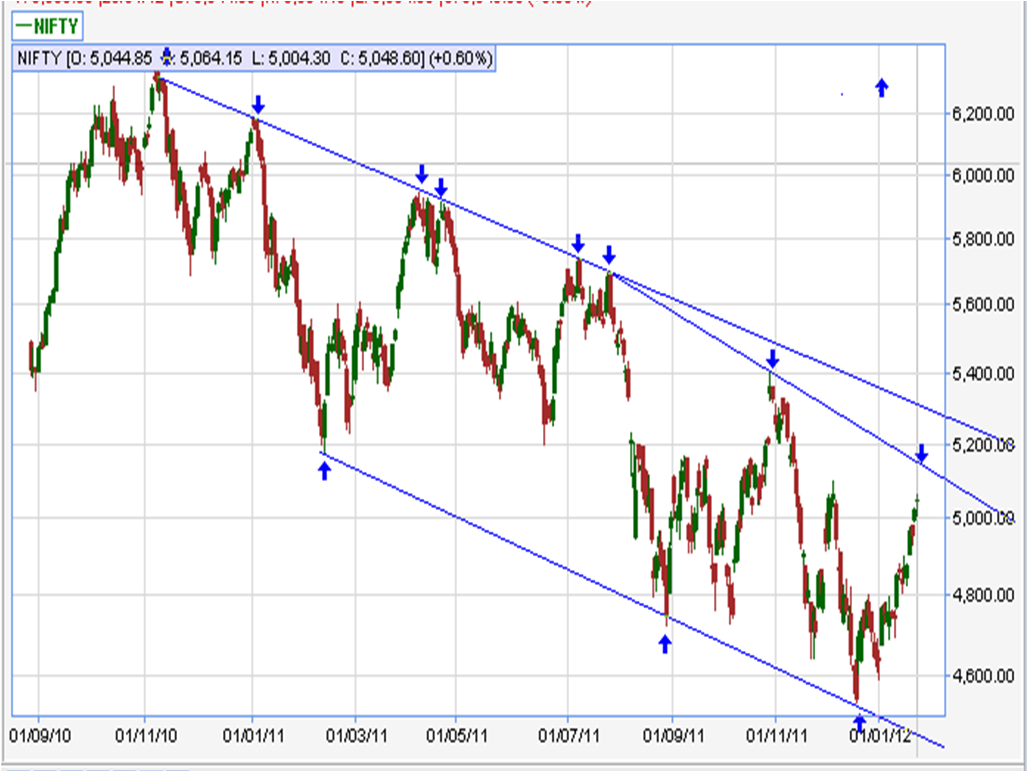
It may be noted that it is the first time in last one and half years that we have seen a continues rise for the market for 4 weeks in succession. So does this indicates the trend has reversed it appears to be not as per EW the wave has not yet completed. I would discuss the EW in the relevant section. One of the important things which have happened during the week is that nifty has been able to move above 200 day EMA which is a positive point for bulls. As its generally believed that bulls survive above it and bears below it. As per this theory bulls have a say. But just we have moved up 200 day EMA last time also market moved above it and there after the market fell by 15-20%. So we have still to wait for confirmation for the same. Another strong feature is that move is that nifty has just broken he sloping trend line drawn from the highs of July 2011 which is a sign of strength of bulls and now they are nearing the trend line drawn from the high of November 2010, which it failed to go past four times earlier will this happen this time also we have to wait and see. The sloping trend line is at 5250-5275 so this line is going to offer considerable resistance. We have to see how easily market goes past it and that would indicate the strength of the bulls. So now we are coming near the real testing time and territory for bulls and bears. As it’s the real test of strength for the both whoever wins the coming move would be substantial. So be prepared for it as it is going to offer good profit potential for the trader. So we are entering into an area where we can have a good profit element for the traders. Another positive thing in the current up move is that the volumes have been good indicating the good amount of buying is going into the market. Only the time would tell whether the buying is genuine or not. Another positive thing is that the on balance volume(OBV) is also moving up indicating that the buying might be genuine.
Positive for the market:
• Nifty has moved above 200 day EMA
• Market is above 200 week EMA.
• Daily MACD is in buy mode and moving up indicating the up move may continue.
• Weekly stochastic oscillator is in buy mode and is moving up indicating the up move to continue.
• Daily stochastic is in buy move but in extremely overbought zone indicating that we might see a slight reversal in coming days.
• Daily RSI is moving into over bought zone above 75 which it went only during the highs of October/November 2010 and may/june 2009.
• Weekly MACD has give a buy signal indicating that we might see up move to continue for some time. it can only be reversed abruptly only when market falls heavily.
Negatives
• 50 day EMA is below 100 day EMA is below 200 day EMA indicating extreme weakness.
• Monthly MACD is in sell mode indicating weakness in the market.
• 15 week EMA is below 50 week and 100 week EMA.
Suddenly we are seeing so many positive signals for the market which is clearly indicating that we might be entering into extremely bullish sentiment after which we might a healthy correction. It appears the sentiment is turning into extremely bullish which might be dangerous as the bears might get the bulls unawares.
I would be giving detail analysis of EW next week as I don’t have time as of today.
But one thing what a match, the Australian open men’s singles final. I have seen one of the best grand slam finals.
M. Sri Mahidar
Trend is Friend
Celebrate Life
Sunday, January 29th 20.15 IST
The movement during the week has been one of the longest journey for bulls in last one and half year so we cannot just ignore the move. There are only two things possible as of now as this is the last desperate attempt of the bulls to decimate bears or start of a new bull run. Only time would tell which it is. So we have to wait for the same. So now the question comes why the market has risen so viciously in the current period. A major elliotte wave has completed at around 4600 levels and the journey is indicating that we are in for a good up move and that is unfolding. Actually I have missed the actual completion as I have seen historically that in January the trend is down and expected the down trend to continue with wave extension.So whether the trend has turned up and down trend is over. As per my analysis its not as the Wave structure as per my analysis seems to be not over. But what actually comes I have to update it if proven wrong. As my motto always is price is king. When ever I ignore the market reminds me this I am wrong. This time I have ignored it and market has just slapped me and said that I am wrong.
It may be noted that it is the first time in last one and half years that we have seen a continues rise for the market for 4 weeks in succession. So does this indicates the trend has reversed it appears to be not as per EW the wave has not yet completed. I would discuss the EW in the relevant section. One of the important things which have happened during the week is that nifty has been able to move above 200 day EMA which is a positive point for bulls. As its generally believed that bulls survive above it and bears below it. As per this theory bulls have a say. But just we have moved up 200 day EMA last time also market moved above it and there after the market fell by 15-20%. So we have still to wait for confirmation for the same. Another strong feature is that move is that nifty has just broken he sloping trend line drawn from the highs of July 2011 which is a sign of strength of bulls and now they are nearing the trend line drawn from the high of November 2010, which it failed to go past four times earlier will this happen this time also we have to wait and see. The sloping trend line is at 5250-5275 so this line is going to offer considerable resistance. We have to see how easily market goes past it and that would indicate the strength of the bulls. So now we are coming near the real testing time and territory for bulls and bears. As it’s the real test of strength for the both whoever wins the coming move would be substantial. So be prepared for it as it is going to offer good profit potential for the trader. So we are entering into an area where we can have a good profit element for the traders. Another positive thing in the current up move is that the volumes have been good indicating the good amount of buying is going into the market. Only the time would tell whether the buying is genuine or not. Another positive thing is that the on balance volume(OBV) is also moving up indicating that the buying might be genuine.
Positive for the market:
• Nifty has moved above 200 day EMA
• Market is above 200 week EMA.
• Daily MACD is in buy mode and moving up indicating the up move may continue.
• Weekly stochastic oscillator is in buy mode and is moving up indicating the up move to continue.
• Daily stochastic is in buy move but in extremely overbought zone indicating that we might see a slight reversal in coming days.
• Daily RSI is moving into over bought zone above 75 which it went only during the highs of October/November 2010 and may/june 2009.
• Weekly MACD has give a buy signal indicating that we might see up move to continue for some time. it can only be reversed abruptly only when market falls heavily.
Negatives
• 50 day EMA is below 100 day EMA is below 200 day EMA indicating extreme weakness.
• Monthly MACD is in sell mode indicating weakness in the market.
• 15 week EMA is below 50 week and 100 week EMA.
Suddenly we are seeing so many positive signals for the market which is clearly indicating that we might be entering into extremely bullish sentiment after which we might a healthy correction. It appears the sentiment is turning into extremely bullish which might be dangerous as the bears might get the bulls unawares.
I would be giving detail analysis of EW next week as I don’t have time as of today.
But one thing what a match, the Australian open men’s singles final. I have seen one of the best grand slam finals.
M. Sri Mahidar
Trend is Friend
Celebrate Life
Sunday, January 29th 20.15 IST