Sunday, April 26, 2015


Weekly technical Analysis for week ended 26th April 2015
Nifty during the week was on a continuing down trend and has closed at the low point of the week which is a sign of weakness. It Opened at a 8618 made a high of 8619 made a low of 8273 and closed at 8305. Nifty is on verge of giving a crossover of 20 day EMA and 50 day EMA if that happens then it would be the for the first time after nearly 21 months( a Fibonacci). As it is happening after nearly 21 months is a bearish indication but still it has not moved below it, if that happens that would surely be a bearish signal. It may be noted that the 20 day EMA 50 day EMA and 100 day EMA are at a distance of just 50 points between, and also 20 day EMA and 50 day EMA are moving down and have chance of moving below 100 day EMA, it that happens then it would be a deadly cross and would signal a bearishness in the market for longer time that expected. So we have to see whether in the coming month we can see the same event or market reverses to make a new high. Nifty is also very near to 200 day EMA which is just 120 points from current level which is first time after nearly one year.
Another point which is worth mentioning is nifty is exactly a the trend line drawn from bottoms of august 2014 any break of the same would also encourage bulls and indicate bearishness for the market in weeks or months to come.
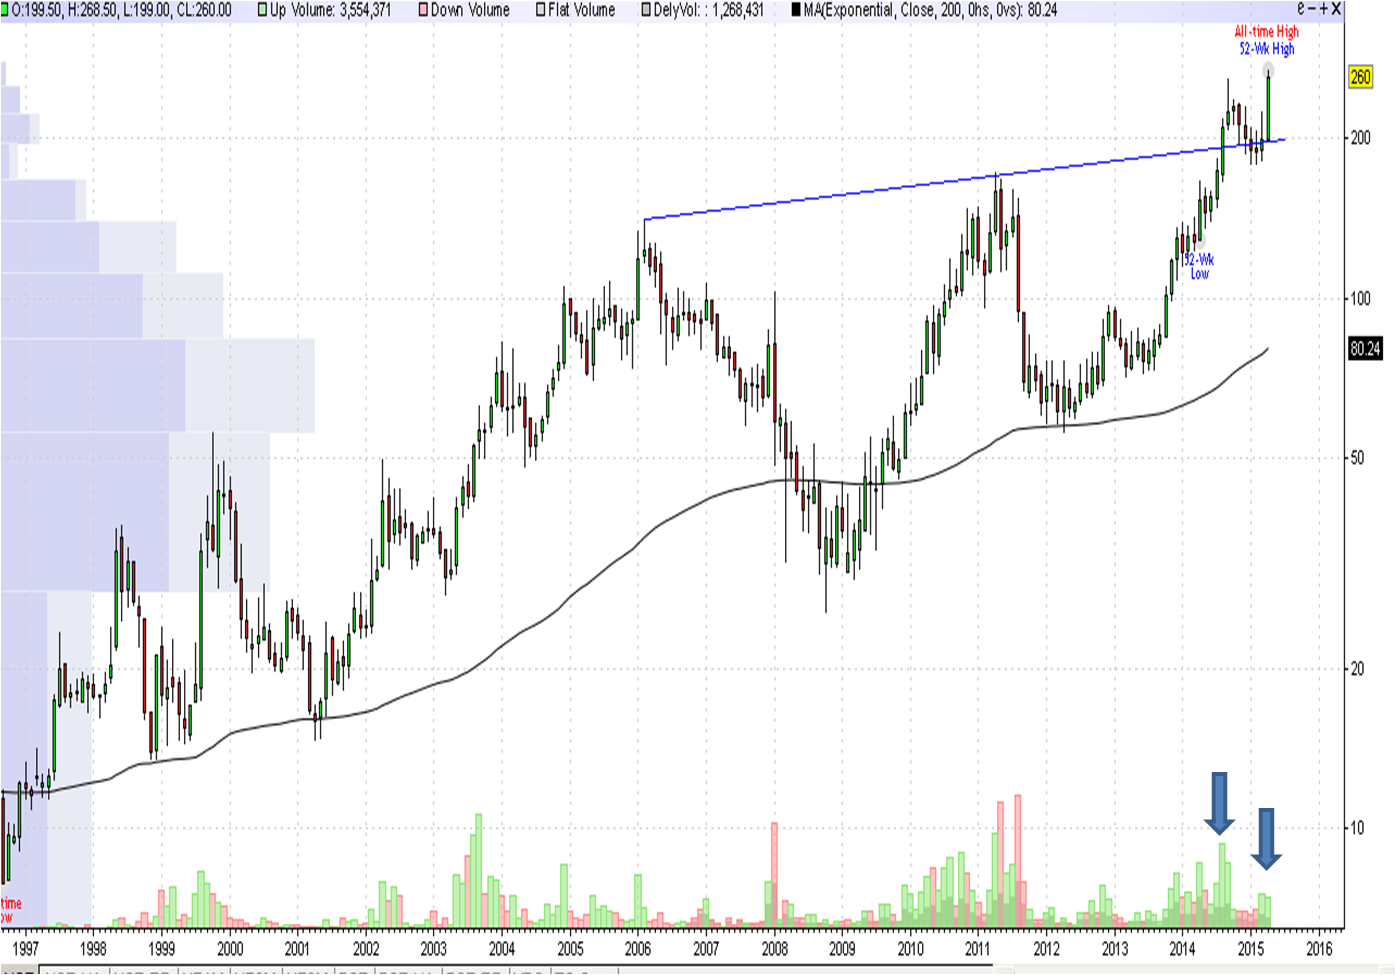

On Slightly larger time frame nifty has broken below the trend line drawn joining bottoms started the start of the current up move from September 2013, (the blue trend line in the above chart) has broken below the trend line in the last week of march and there after again moved above it in the current month and again moved below it during this week. This is a clear picture of weakness of the market. The trend line is now offering resistance which is a bad sign for bulls. So unless and otherwise market move above the trend line we can expect further down side in coming weeks or months.
Next week we would see what would be the probable targets if the same happens.

Mahiidar M
Enjoying Life
Trend is Friend
Sunday 26th April 2015 Time:4.11 PM(IST)

Wednesday, April 22, 2015

Bank Nifty has formed a very bearish signal after 21 months so cannot be ignored. first the 20 day EMA has moved below 50 day EMA in the beginning of this month. this has happened after August 2013 and 20 day EMA is now on the verge of moving below 100 day EMA if that happens then it would be first time after January 2013. So all these are pointing towards bearishness in Bank nifty which should also reflect in Nifty also we would see it later. 
There is also another bearish pattern which has been formed over a period of five months which most of the analysts seems to have missed. Bank nifty has formed Heads and Shoulders over a period of five months and it has  broken below the neck line in march last week moved down then moved up and it touched the neck line and started to move move down a perfect H&S pattern. If it is not negated then bank nifty can all the way go to 16500 levels to achieve the target (H&S implications) whether bnf would go to that level which is nearly 2000 points from current levels it seems so. So bulls in Bank nifty be careful.

Mahiidar M
Enjoying Life
Trend is Friend.

Friday, April 17, 2015

Idear Celluear: Rs.196 the stock has made a new all time high indicating strength in the stock and bulls are dominating the stock. It can be seen from the monthly chart above that the stock has formed an cup and Handle pattern over a period of 7-8 years and it seems to have broken above the neck line which should be a bullish sign for the stock. The long time taken for formation of the pattern is a very bullish sign. Fundamentally there is no introduction required its a leading telcom service provider india next only to Bharti Airtel as far as i know. Stop loss any close below 200 day EMA.

Mahiidar M
Enjoying Life
Trend is Friend

Wednesday, April 15, 2015

JB Chemicals and Pharma-Rs.260/- The stock made an all time high which is an indication of bulls getting stronger in the stock. The stock has made all time high in august and there after for eight months consolidated at the ATH came down and touched the break out neck line then started to move up which is a very bullish signal. So this is a stock which bulls are active as of now. Stop Loss:180 levels.

Mahiidar M
Enjoying Life
Trend is Friend.

Sunday, April 12, 2015

Voltas Ltd- Rs.306/- has made an all time high after nearly 7 years. It has failed to move above Rs.270 Levels atleast three times and this time it successfully went over it. Notice the volumes are heavy indicating the some informed buying has gone into the stock and it has all the potential to move up substantially from current levels. Fundamentally there is no introduction required by the company it is a leading engineering, mining, construction equipments and solutions. So considering the infrastructure push of the current government we can expect healthy movement in long term. It appears the move has just started. Stop Loss:227/-.

Mahiidar M
Enjoying Life
Trend is Friend.


Weekly technical Analysis for week ended 11th April 2015
For the entire week nifty has been moving up, all the five days close was higher than that of the previous days indicating that bulls are dominating the market. One of the positive things about the market is that nifty has taken support at 100 day EMA and moved above 50 day and 20 day EMA. During last one and half years nifty has been finding support at 100 day EMA and this time also it has bounced from the same level. So 100 day EMA is the indicator which has to be watched carefully. 100 day EMA is at 8510 and 200 day EMA is at 8151 so these are the two levels to be watched carefully in weeks to come. For short term 20 day EMA and 50 Day EMA are to be watched as they are as of now near the price. 20 day EMA is at 8645 and 50 day EMA is at 8585 so these are the levels to be watched out for in short term.
One thing which is som what worrying is that even though market is moving up the candle formation is indicating nervousness in the market which would be known only as the time progresses. The body of the candles is very less compared to range. As of now market appears to be in a indecisive mode so we have to wait for it to give a clear break out.
Elliott wave point of you nothing is happening so I would wait for some time before give the same as we may have to frequently change the structure in this case. So have patience in some time the picture would be clear.\
Mahiidar M
Enjoying Life
Trend is Friend.

Thursday, April 9, 2015


RSWM-Rs.240/- The stock has made an all time high which is a bullish signal for the stock. The stock has been trying to move above Rs.250/- for last 20 years and it seems to be successful this time. it has still not confirmed the same so it has to strongly close above 250 levels on weekly or monthy chart which would be very good for the bulls in the stock. Note that the stock has failed thrice to move above 250 once in 1995, second time in 2008 and 3rd time in 2014 and this time again its at 250 levels. So its better for the market to confirms the same but i thing it might be successful this time and if that happens that would be huge positive for bulls. one point to be noted is that the stock has closed at all time high this itself is a bullish sign. Stop Loss:180/-

Mahiidar M
Enjoying Life
Trend is Friend.

Wednesday, April 8, 2015

Mindtech India Rs.85/- the stock seems to have made an all time high after nearly six months of consolidation. The above chart is a monthly chart. Notice the volumes which are very heavy compared compared to last 14 years which is a clear indication that informed investors might be logging into the stock expecting better future in the stock. The financials have been improving over last three to four years which is being justified by movement in the stock. So it appears that investors are betting on further improvement of financials which has all the potential to propel the stock higher. Stop loss: Rs.55/-

Mahiidar M
Enjoying Life
Trend is Friend.

Tuesday, April 7, 2015

United Breweries : Rs.1112/- United Breweries has made a new all time high which generally gives a buy signal The stock has consolidated for nearly two years before making a new high so gives chances of good upside potential in the stock in weeks/months to come. The stock has taken support exactly at 200 week EMA and started to move up and made a new high which gives an indication that the stock is poised for further upsides in future. The company is a leader is breweries business in india and holds the brand "king Fisher". Stop Loss:Rs-945/-

Mahiidar M
Enjoying Life
Trend is Friend.
VTL - Rs.570/- Vardhman Textiles Ltd has made an all time high today. It seems the stock can easily move places from current levels. It has Made an all time high in june move towards 500 levels then came back and took support exactly at the break out level and then started to move up the volumes on break out were heavy indicating that the investor interest is slowly coming into the stock. Fundamentally the company has fantastic financials its profitability has been increasing trend over last 10 years and except for TTM where in the profitability has come down. But its is a consistent dividend paying company. Stop Loss at break out level around Rs.400/-

Mahiidar M
Enjoying Life
Trend is Freind
Elecon Eng: Rs.78/-. the stock seems to be heading higher  in coming weeks/months. the stock has successfully move above 200 week EMA after 2008 which itself is a bullish signal. it move above 200 week EMA can down took support exactly at that and then started moving up on huge volumes which is a bullish signal. The heavy volumes indicate that the investor interest is coming into the stock and informed investors are buying into it expecting a better future for the stock. The financials lately are not so encouraging. But fundamentally the stock good and has a good business model.

Mahiidar M
Enjoying Life
Trend is Friend.