Sunday, March 30, 2014

Weekly technical Analysis for week ended 29th March 2014
Nifty during the week has opened on a positive note and has continued to move up on each day and virtually closed at the top an all time high. As the index is making a continues up move and that too a new high we can assume that the sentiment of the market is bullish and we have to wait for the market to reverse before taking any decision of shorting the market. Shorting the market is going against the trend/tide which is not advised as it can lead to huge losses as they mount, just accept that market is right and get out of the market. Its either be long or just sit and enjoy the market.

I have indicated in my earlier updates that we might be forming an expanding triangle and we are in forming in the fifth wave and we might end at any point of time. This week we would look into the up move from the start of this up move from December 2011 low of 4637 to the current high of 6702.

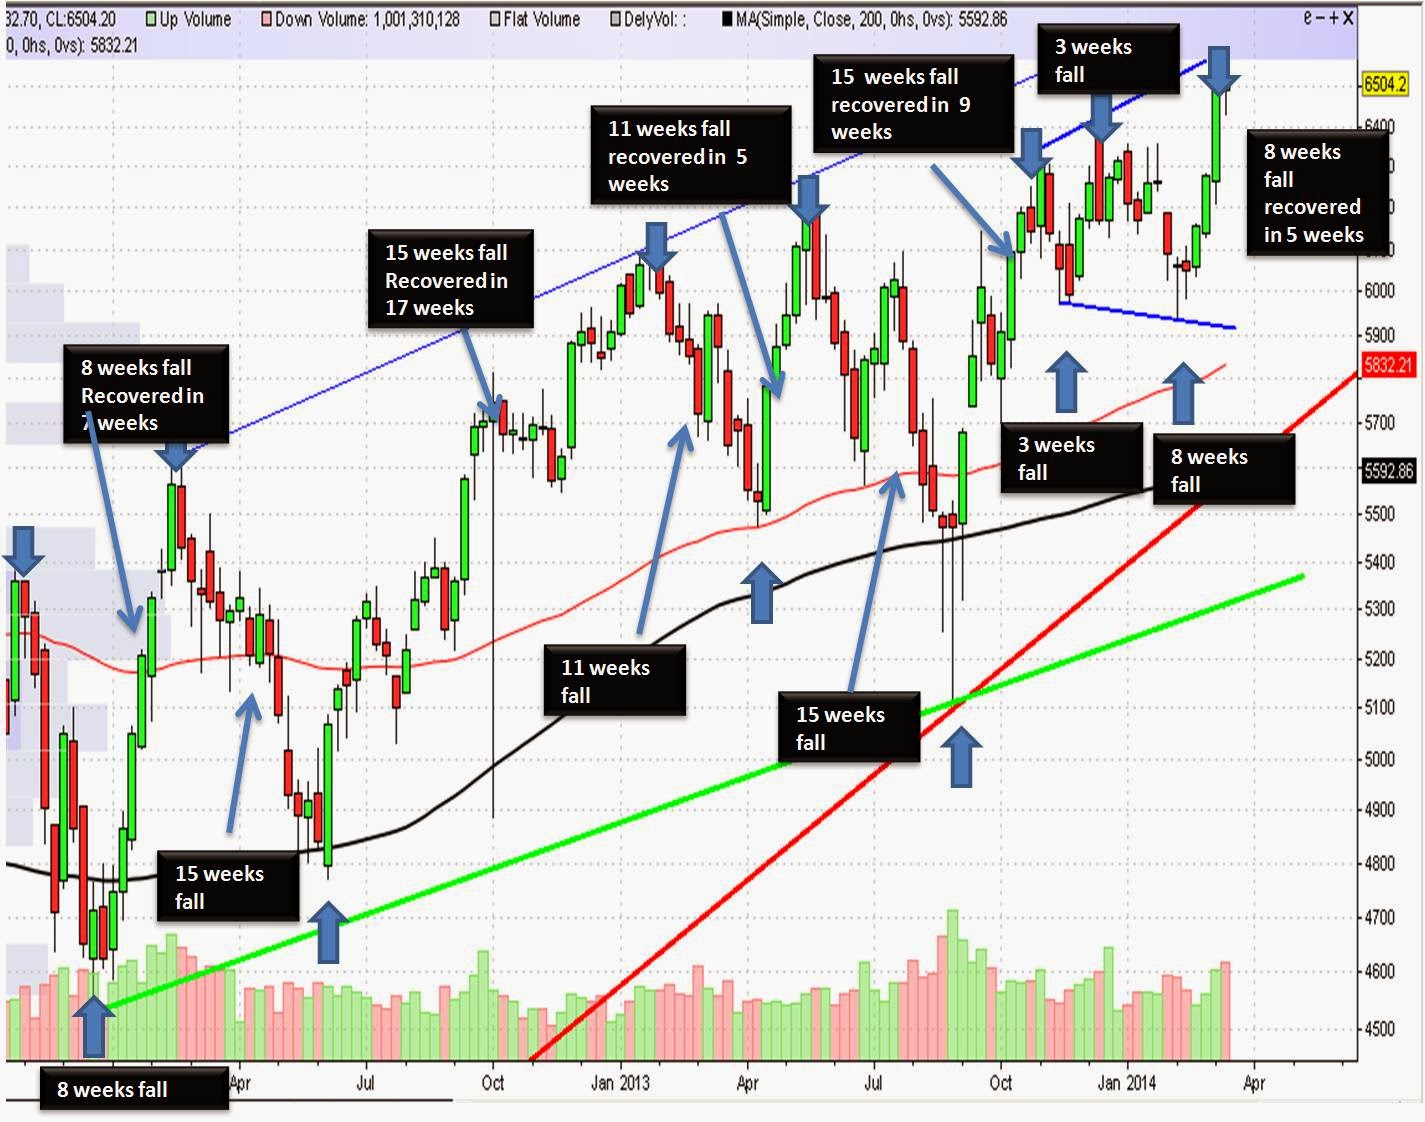
First we look into the larger picture from December 2011 low to this Fridays high.

 
The above chart is from the low of December 2011 of 4637 to Fridays high of 6702 a rise of nearly 2100 points a phenomenal rise. It can be seen that the rise for last two and half years has been within a trading channel represented by black lines. We can clearly see that the market was rising within the channel only and the market was respecting the support and resistance lines. It can be seen from the above chart that the market was finding resistance line indicated by arrows, and whenever it touched the resistance line the correction was in a big way. It can be seen in the chart that now we are nearing the two and half year resistance line so we can assume that we might be in forming some topping formation we have to go for details of the wave to see whether we are in topping formation or we can just give a break away formation.

The expanding triangle formation from September 2013 onwards.


It can be seen from the above chart that the market is forming an expanding triangle from last six months and it seems that we are in formation of the fifth wave of the same and on completion of the same we can expect the market to move down in a bigger way, till that happens we have to see for possible upsides opening up.

 Elliotte wave break up of the fifth wave
 
Given above is the Elliott wave breakup of the fifth wave of the expanding triangle. As has been indicated earlier also, it seems that we are in formation of the fifth wave of the triangle and we are also in formation of the fifth wave of the fifth and the fifth of the fifth is further breaking down into its components which is giving and indication the we might further move up before the wave culminates. I would post updates of the same regularly as it the wave structure progresses. It can be seen that the market is moving in the channel indicated by orange dotted lines till that is in the channel we would be moving up. Any break of the channel would signal the probable end of the wave. So now comes the question of how far the market can move up in the present move. So we can have targets of 6671,6746,6820 and 7061. Market has all fair chances of culminating at any of these targets. 6671 is already achieved and we are near the second target. So keep a watch on these targets and also the wave structure also the wave structure is indicating that we might move towards 6820 before culminating but wait for the market to give an indication.

M.Sri Mahidar
Trend is Friend
30th March 2014

Thursday, March 27, 2014

Nifty seems to have completed the 5 wave up move as indicated in the above chart. I have indicated in the morning that we are in the formation of 5th wave of the 5th of the expanding triangle. and it appears that we might have completed the up move, unless and other wise the 5th wave breaks itself into its components. So we have to wait for the faster retracement for confirmation of the end of up move.
Another thing to be observed is the nifty has completed Thomas Demarks TD sell sequential on the close of today. it is a major indicator. it has completed the TD sell set up and we have to wait for the market to move or close below the low of the 13th bar, to indicate trend reversal in daily charts and with stop loss at the high of the 13th bar. I have tried this TD sequential for last one to two years and except once all the times it was successful and the correction was very severe. This time bank nifty has not formed a TD sequential that the only negative in this, previously both Nifty and bank nifty has formed TD sequential simultaneously. But patter is a pattern and we have to wait for the confirmation in this method also so any close below 6599 which is the low of the 13th bar with a stop loss of high of today.

M.Sri Mahidar
Trend is Friend.
As has been indicated three weeks back nifty is forming a expanding triangle and also that we are in the final wave the fifth wave. I have now furnished the elliotte wave break up of the fifth wave, its indicating that it is in completion of fifth of fifth and we are also nearing the A-C trend line, which is clearly indicating that we are in the final stages of completion of the same, Once completed we can expect nifty to correct around 200 to 300 points. The fifth wave can also expand in which case we can see the market moving further up but one point is sure we are in the final stages of up move.
M.Sri Mahidar
Trend is Friend.

Sunday, March 16, 2014

Weekly technical Analysis for week ended 14th March 2014
The market during the week, was on a close range, it has opened on a positive note there after was in a range then fell on Thursday but recovered the loss on Friday, all in all in a close range. In the weekly charts the market has formed a doji indicating that the bulls and bears were no able to decide the direction of the market. So the coming week is going to decide on the direction of the market. So technically nothing has happened to the market compared what we have discussed in last week. One thing is to be noted is that the market was able to sustain above the all time high for the entire one week which is a positive sign for bulls in the coming week. The longer the market stays in all time high region bulls would be happy with the same.
We would see the time of retracement to see whether the time signifies the strength of the bulls. We would see the shorter time frame and also larger time frames to see, what the time lines say about the market.

First we see the shorter time frame for last two years.


The above chart is the weekly chart of nifty for the last two years. It can be seen from the chart above that all the falls of the last two years are being retraced in shorter period of time, and each fall was taking longer time to fall but unable to go below the previous low. During the entire period the market has fallen and the recovery was around 50% of the tme.All this is indicating that all during the last two years bulls were showing strength and bears were unable to take the market below their previous lows which was a clear sign of bullishness which everyone has missed. So till there is faster retracement of the fall the trend is not reversed in short term also. So till that event happens we can be sure that the trend has not reversed.

Now we would see for longer time frame
 In Last three years from  November 2010 high.


It can be seen from the chart that the fall from November 2010 to December 2011 fall was in 60 weeks and the same was recovered from December 2011low to high of December 2013 high took nearly 106 weeks which is nearly 180% of the time taken to fall. I you see from longer period from January 2008 highs the fall of 2008 took 62 weeks to fall from 6354 to low of around 2500 and it has taken  nearly 254 weeks to recover the entire rise, the recovery has taken nearly 4 times the time.  As Per the Elliott wave the last wave of the larger wave should e recovered in shorter period to signify the trend reversal but till not that has not happened so it appears that the larger trend is down but there is uptrend in shorted term so we have to enjoy with bulls till the trend reverses in shorter time period till that time bulls would rule.
M.Sri Mahidar
Trend is Friend

16th of March 2014

Tuesday, March 11, 2014

Mind Tech(India)ltd - Rs.35


Mind tech Limited seems to have come out of consolidation for last 13 years. it has fallen from around Rs.500 Levels in 2000 to around 10 levels in 2012-13. The stock seems to have formed a triangle over a period of last 13 years and has broke out of it lately. Even the volumes were very high on break out confirming the genuiness of  the break out. Techncially target is on very high. Stop Loss:200 day EMA currently at Rs.24.
 
M.Sri Mahidar
Trend is Friend.

Sunday, March 9, 2014

Weekly technical Analysis for week ended 8th March 2014
Markets during the week have risen phenomenally; it closed at all time high. What is to be noted is that the ease at which it has gone above the all time high. Nifty has never closed above 6400, during last one year it tried to move past the 2008 high and every time it went near or gone past it, nifty has corrected heavily. This time also in December it went there and then started the move down. But this time it moved past this level with ease and very strongly and with huge volumes indicating that we might have just gone above the formidable resistance level and in my view any new high has to be respected which indicates clearly that the bulls have decimated bears and are ready to take market to a new high. So we have to respect the new high whatever may be the state of the market/economy.  Large part of the move is contributed by the banking stocks and also Reliance which has risen nearly Rs.50 on single day which is a rarity for reliance. I have seen over the years that when ever reliance move it takes market with it so, se have to see how far the it can take the market.

During my previous update I have indicated that we are moving in a trading range between 100 day EMA and 200 day EMA and any move on either side would result in a big move. And it has moved above the 100 day EMA and we can see the move after that as the trading range of nearly two months was broken. The extent of move of the market has surprised even the strongest bulls. Now we have to see what the patterns the market is forming and what the probable upsides for the market are?
In the daily chart market seems to be forming a expanding triangle and now it appears that we might be moving up in the fifth wave as per the current structure, as of now the structure is not clear but as of now it is the probable structure.

It can be seen from the above chart that the range break out has happened and we a move has happened. It can also be seen from the chart that we are forming an expanding triangle (the pattern might change as the time progresses), and we are in the fifth wave of the pattern. Generally the in case of expanding triangle pattern the fifth wave would be the longest and also the most swift and the most violent wave and the volumes would also be very high during the formation of fifth wave giving the indication if trend reversal, already it is the longest wave as of now. So now comes what is the target for the fifth wave? Generally it goes and moves above the AC trend line; this gives an indication that we might still have some upsides for the market.

M.Sri Mahidar
Trend is Friend
9th of September 2014