Sunday, May 25, 2014

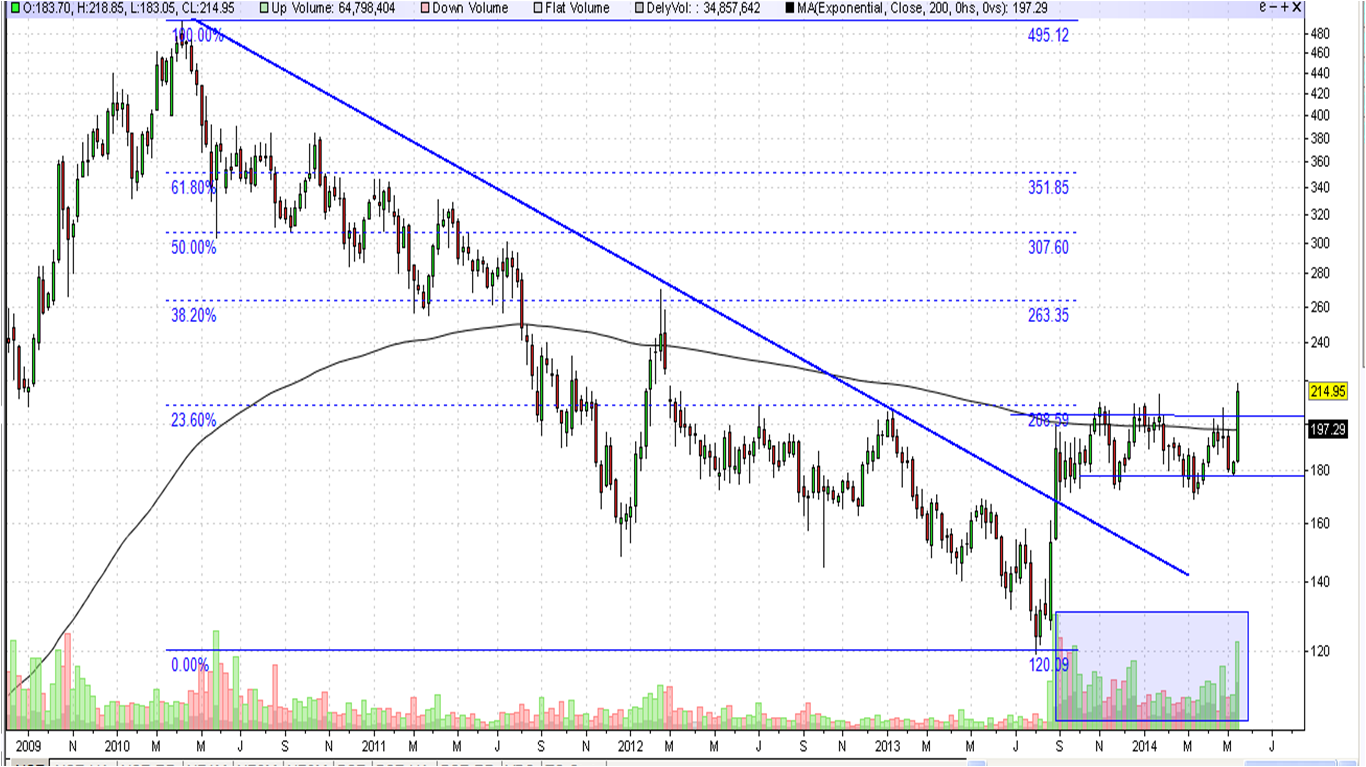
 The stock has move above the 200 week EMA. It has consolidated around 200 Week EMA and then started to move up so a good technical buy. in the mean time the stock has also moved or broken above the sloping trend line(blue Line) drawn from the top of April 2006. which is nearly 8 years( fibonacci) which is indicating that the trend might have reversed and we might see the stock move substantially from the current levels.We may not be surprised even if it make a new high which is around Rs.500. Generally such a long term trend line breakup signals trend reversals and the stocks goes on to move above previous high. so a good buy with stop loss of Rs.130/-.

M.MahidaRSri
Trend is Friend.
Enjoying Life

Speciality Resturants;Rs.156

Specialty Restaurant the stock price has moved above 200 day EMA then came down and took support there and then started to move up the volumes are also increasing which is indicating that the upside potential has developed and i may move up from current levels. The stock has moved above 200 week EMA which is also one of the power technical break out. so the stock have be bought with stop loss at Rs.135
M.MahidaRSri
Trend is Friend
Enjoying Life

Friday, May 23, 2014

Asahi Songwon Colors: Rs.97

Asahi songwon has just made a 52 week high you can see in the chart it is trying to break above the line its about to make a all time high which is very good techncially to buy a stock. Fundamentally the company has been performing well from last five years and fundamentals are also showing improvement so a good buy fundamentally and technically. Stop Loss 10% from current levels.
M.MahidaRSri
Trend is Friend.

Wednesday, May 21, 2014

Amtek India: Rs.76/-

Amtek india stock is a strong technical buy, it has moved above the 200 week EMA with huge volumes and then it retraced back to 200 week and is just about to move up so its a good technical buy. fundamentally also the company has been working good for last few years and its financial are improving.Recently the group has acquired some europian companies which in future would improve its financials. So a good buy technically and also improving fundamentals.stop Loss Rs.70/- so margin of safety is very high. it appears that we might soon see 52 week high and also all time high so we can expect nearly doubling from current levels.

M.MahidaRSri
Enjoying Life
Trend is Friend.
Balrampur Chini Mills - Rs.69/-

Balrampur chini has give a good results for the quarter ended 2014 for single quarter it has give an EPS of 7.50 which is really good. So it seems the margins are improving but still another quarter results would confirm the same considering the firming of international sugar prices. the stock has moved above the 200 week EMA which really very very good and it trending up it appears that its first resistance is around Rs.100 where the trend line is there drawn from the top of 2006 so very long term trend line. Any break of the same has chances of taking further up. So good fundamental and technical buy with Stop Loss at 200 week EMA which is at Rs.57

M.MahidaRSri
Enjoying Life
Trend is Friend
Shree Renuka Sugars: Rs.24.


Renuka sugars- a leading producer in india has started to move up. It has moved above 200 day EMA and was maintaining around that level only for last six months and for last two day has started to move up and made a 52 week high and that too on heavy volumes, this is giving a clear indication that the stock price is poised for a big move considering the amount of consolidation. Also the sugar prices are firming up and it appears that the stock price is poised for a big move from current levels. so a good buy also the wilmar deal is going to reduce the debt which is directly going to reduce debt which would increase PAT all this is pointing towards better days for stock. Stop loss below Rs.20

M.MahidaRSri
Trend is Friend.

Sunday, May 18, 2014

Sesa Sterlite- 214
Sesa sterlite after consolidating around the 200 week EMA for nearly six months has broken above it with very heavy volumes. See the volumes at the consolidation indicating that good amount of accumulation has gone into the stock and now we can see a healthy movement from the current levels. historically seen when ever the stock has moved above 200 week EMA the stock at-least doubled to tripled from that level. so we can hope a healthy movement from the current levels. Stop loss should be the low of the consolidation which is around 170.
Jindal Saw-64


The stock has moved above the 200 day EMA after a long time. also note the volumes, they were very very high on break out above 200 day EMA which is giving an indication that the break out is genuine and the stock has potential to move up from here. Stop Loss 55.
SPML Infra - Rs.44

SPML infra the stock has moved above the 200 day EMA after nearly three years and now it has moved above it then retraced to 200 day EMA and about to move up now so a perfect technical buy with Stop Loss at 36.00. The company is a leading player in infra space. As the infrastructure space is about to turn around post mr.Modis PM, the margin of safety is very high as the stop loss is just 15% below the acquisition price. So its a technical and fundamental buy.


Wednesday, May 14, 2014

Public Sector Banks: there is something in the PSU banks. all the stocks have formed a similar patter and have give a break out at about same time and have started to move up. You might be thinking what is the pattern. All the PSU banks were hammered in last two and half years they have fallen by 60% to 70% from the top of 2011 and they have now moved above the 200 day EMA all at once and they have moved above it and then can back took support at 200 day EMA again and started to move up which is a very good technically. So considering this we can expect a healthy movement in the PSU banking sector in coming weeks. Also on the break out the volumes were heavy indicating that the interest is coming into the PSU banking sector. Techncially it appears that we might see atleast 20 to 30% move in these stocks. in any case the stop loss should be 200 day EMA. It they move below 200 day EMA just get out.

The charts are furnished below


 M.Mahidar Sri
Trend is Friend

Tuesday, May 13, 2014

Praj Industries: Rs.57/- the stock has broken the sloping trend line drawn from the top of 2008 which indicates probable trend reversal in the stock. even though the fundamentals have not improved technicals are indicating a trend reversal as six year trend line has been taken out. So technically the stock is a buy with Stop Loss at Rs.50.

M.Mahidar Sri
Enjoying Life

Punj Lloyd


Punj Lloyd:- also seems to be comming out of hibernation after nearly 6 years, it has been falling continually from 2008 as its financial position was continually becoming worst. if you see the chart from 2008 onwards the stock has been trading below 200 day EMA except for a three to four months in 2009. Now it has currently moved above 200 day EMA. If you see the second chart it has tried twice in last six months and failed indicated by red down facing arrows and in the third attempt it has moved above it then it retraced and move below it and not strongly moved above it which is a perfect technical set up as the stop loss is just near only the margin of safety is high. another point ot be noted is that if you can see in the first chart any move above 37 would result in the sloping trend line drawn from the top of 2008 is taken out which generally signifies a trend reversal in the stock. So watch out for Rs.36 as any move above it would trigger an upside movement of at-least 50% from that levels. Fundamentals have still not improved but generally technical s first show the reversals followed by  fundamentals. So as of now its a technical buy with stright stop loss of Rs.28.

M.Mahidar Sri
Trend is Friend.


Gammon India

Gammon India has moved above the 200 day EMA after october 2010 which is nearly 3 years, the break out is indicating that the stock is comming out of hibernation and it has chances of moving higher from current levels. The minimum retracement of fibonacci is comming to around 74 levels which is substantilly up from current levels of 18. It has also moved above 200 day EMA came down and took support at 200 day EMA and then now started to move up which is perfect technical set up and we can expect good movement from current levels. My personal view is that we can easily double from current level. what ever may be the case the stop loss should be any weekly close below 200 day EMA.

M.Mahidar Sri
Trend is Friend.

Friday, May 2, 2014

Polaris Financial technologies:

the stocks seems to be coming out of hibernation of nearly 13 years. the stock has been forming inverted heads and shoulders pattern over the period of 12-13 years this is very very long time for the pattern. it can be seen from the chart that the stock has been unable to break above the neck line at-least four times and this time it has broke above the neck line and that too on heavy volumes which is clearly indicating that the trend might be reversing. So techncially the stock has is a good buy with stop loss below the neck line. fundamentally the financials have been improving over fives years at CAGR at around 20% for last five years so it appears to be a good buy from current levels with stop loss at neck line, in any case the stop loss at 200 day EMA which happens to be around 140. The reverse h&S pattern is giving a target of double from the current levels.  But the very long term pattern formation is giving an indication that we might see a new all time high in years to come provided it stays above the neck line. 

M.Sri Mahidar
Trend is Friend. 

Thursday, May 1, 2014

Nifty Update

nifty for the first time in the current rise from the 5950 the retracement of the last was done in a shorter time than the rise which is indicating that trend is turning weak. if the wave structure is complete the we can see the retracement to the low of the 4th wave low where in give a target around 6450 levels. If we apply fibonacci retracements then we have achieved the minimum retracement of 23.60%, if its taken out then we have chances of moving towards 38.20% and 50% retracement. which give a targets of 6512 and 6401, will it go to these levels it appears to be so. we have to wait till it is acheived or negated. on of the things to be noted is that nifty has also gone below 20 day EMA for the first time after nearly one and half month which indicates the the market has become weak, it has to move above it to confirm some strength so wait and watch for the same.
M.Sri Mahidar
Trend is Friend
Enjoying Life