Tuesday, June 24, 2014

Easun Royal :- Rs.81
Easun Royal has broken above 200 week EMA and has consolidating above it for last four weeks and volumes are also increasing indicating that we are in for a good up move in the stock. as the stock is just above 200 week EMA the margin of safety is very high. Fundamentally the company is not performing well but the stock is into engineering sector with infra focus so has all possible chances of moving up from current levels. Stop loss Rs.70/-

Wednesday, June 18, 2014

Globus Spirits:Rs.83/-

Globus spirits has been continually falling from 2010 onwards and not it has moved above 200 day EMA, and volumes are slightly increasing which indicates that interest is coming into the stock and has all chances of moving up. so a good buy. financially the stock has not been performing well for last two years. the volumes are increasing indicate that the fundamentals might improve which would confirm the up move. stop loss should be strightly below 200 day EMA which happens to be below 80/- and should not be held any case below Rs.74/-

M.MahidarSri
Trend is Friend
Enjoying Life
Tilak Nagar Industries Ltd:Rs.58/-


Tilak nagar industries limited as can be seen in the chart above is in a consolidation range for the last two years and has been oscillating around 200 week EMA. it can be seen that the for the last two to three months the volumes are increasing and the price has moved above 200 week EMA. once the break out of the resistance line would confirm the same. The increase in volumes is clearly indicating that we might get a break out. Stop Loss:50/- so the margin of safety is very high.

M.MahidarSri
Trend is Friend
Enjoying Life.


Wednesday, June 11, 2014

Aptech Ltd- 103


The stock seems to have broke above the sloping trend line of last six years which is a bullish signal. it has broken above it with huge volumes today signifying that some buying interest is coming into the stock and we might see stock moving towards 130 and 200 levels. Stop  loss:80/-

M.Mahidar Sri
Trend is Friend
Enjoying Life

KCP sugar - 26


the stock has formed a triangle consolidation pattern over a period of 6 years and now seems to have broke above the b-d line with volumes. this is indicating that we might see a good movement in the stock.As sugar industry is looking up we might see some healthy movement in the stock.
Stop Loss-18/-

M.Mahidar Sri
Trend is Friend 
Enjoying Life

Tuesday, June 10, 2014

Omaxe - 148/-

omaxe ltd has been in consolidating ramge from 2010 onwards and this week it has moved above the resistance line which it has to failed last two attempts in last four years. Now it has broke above the resistance line which is indicating  that the trend has reversed to up and it on course of an uptrend. notice the volumes indicated down side the volumes are increasing over a period of last four to five months which is also an indication that we are in for a healthy movement in the stock. So a good buy at this price with stop loss at 200 week EMA at Rs.120/-.

M.MahidarSri
Trend is Friend.
Enjoying Life

Thursday, June 5, 2014

Suven Life Sciences - Rs.89/-

suven life science has give a break out above 80 nearly one month  back and has been consolidating above the break out level. this is an indication of good bull power building up and also the volumes are also increasing gradually which is pointing towards a possible up move in coming weeks. fundamentally the stock has been performing exceedingly well. its EPS has grown mov that 300% quarter on quarter for last five quarters. each quarter its EPS was more that 300% of the relevant quarter. all this is pointing towards a good fundamentals and a probable up move post break up consolidation. Stop Loss: 70/-

M.MahidaR Sri
Trend is Friend
Enjoying Life

Asahi Songwon- has give break out today on moving and closing above 100 which is a very good sign. i have recently at around Rs.90 levels has given the technical break out and today it has confirmed the same.
IDFC - 135
IDFC seems to be building base for a sustained bull run. As it can be seen from the chart that the stock has moved above the 200 day EMA and also moved above 200 week EMA both of which are most power full indicators of bullishness in the stock. The 100 day EMA has moved above the 200 day EMA which is very bullish signal and generally it signifies a healthy movement is about to come over weeks or months to come. historically 2 out of 3 times when ever 100 day EMA has moved above 200 day EMA the stock has more that doubled. will this happen this time only time will tell. what ever may be the case the stop loss should be:Rs.110

M.MahidaRSri
Trend is Friend
Enjoying Life

Wednesday, June 4, 2014

Dishman Pharma- Rs.99/-


Dishman Pharma seems to have just give a break out. refer to chart above. during last five months it has taken support at the 200 day EMA four times and was in the range of 85 to 90 and today it broke above the range and that toooo with heavy volumes which confirms the up move has just begun. the Volumes traded during the range trading indicates that good amount of accumulation has gone into the stock and we might easily see it raising 30% from current levels. so a very good buy technically. fundamentally also it has TTM EPS of 19 against the EPS of 13 for FY-13 and also for the quarter ended March 2014 has an EPS of 8.65 an increase of 276% and for the quarter ended dec 2013 EPS increase of 163% which clearly states that the stock is poised for good days to come so a good buy at this price both fundamentally and technically. Stop loss below 200 day EMA.80/-

M.MahidaRSri
Trend is Friend
Enjoying Life

Monday, June 2, 2014

Hariyana Ship Breakers:Rs.62/-

Hariyana Ship breakers has broken out of nearly 10 year consolidation range, it was stuck between 20-55 for last 10 years and now today it has broke out of it and has made an all time high which clearly indicates that the stock is poised for a healthy break out. One can expect the stock to double from the current level. the TTM EPS of the stock is 20 so quoting at a pe of 3 only. The companies EPS has increased from 9 to 27 over a period of 5 years but the stock price was stuck in range only. the fundamentals have improved a lot but price has not reflected the increased fundamentals. The company has give an EPS of 33 in the last two quarters. So the fundamentals are improving and the break out now is a good sign. so a safe bet as on now. Stop Loss Rs.400-

Sunday, June 1, 2014


Weekly technical Analysis for week ended 30th May 2014

Nifty during the week opened on a high note moved up and made a high of 7428 on Monday and there after started to move down and all during the week the market was forming only red candles and moving down and it made a low of 7118 and finally closed at 7229. Whole during the week the market was in the range of the 16th may opening candle only. During the last two week the market was in the range of the opening candle of 16th May (election result day) and on Friday it moved below the low of the 16th may candle. The movement in the range of the candle is indicating the there is some amount of selling coming into the market in short term as at every rise selling is coming. The long tail on 16th itself is indication the heavy selling has gone into it and it would require an fair amount of buying to 
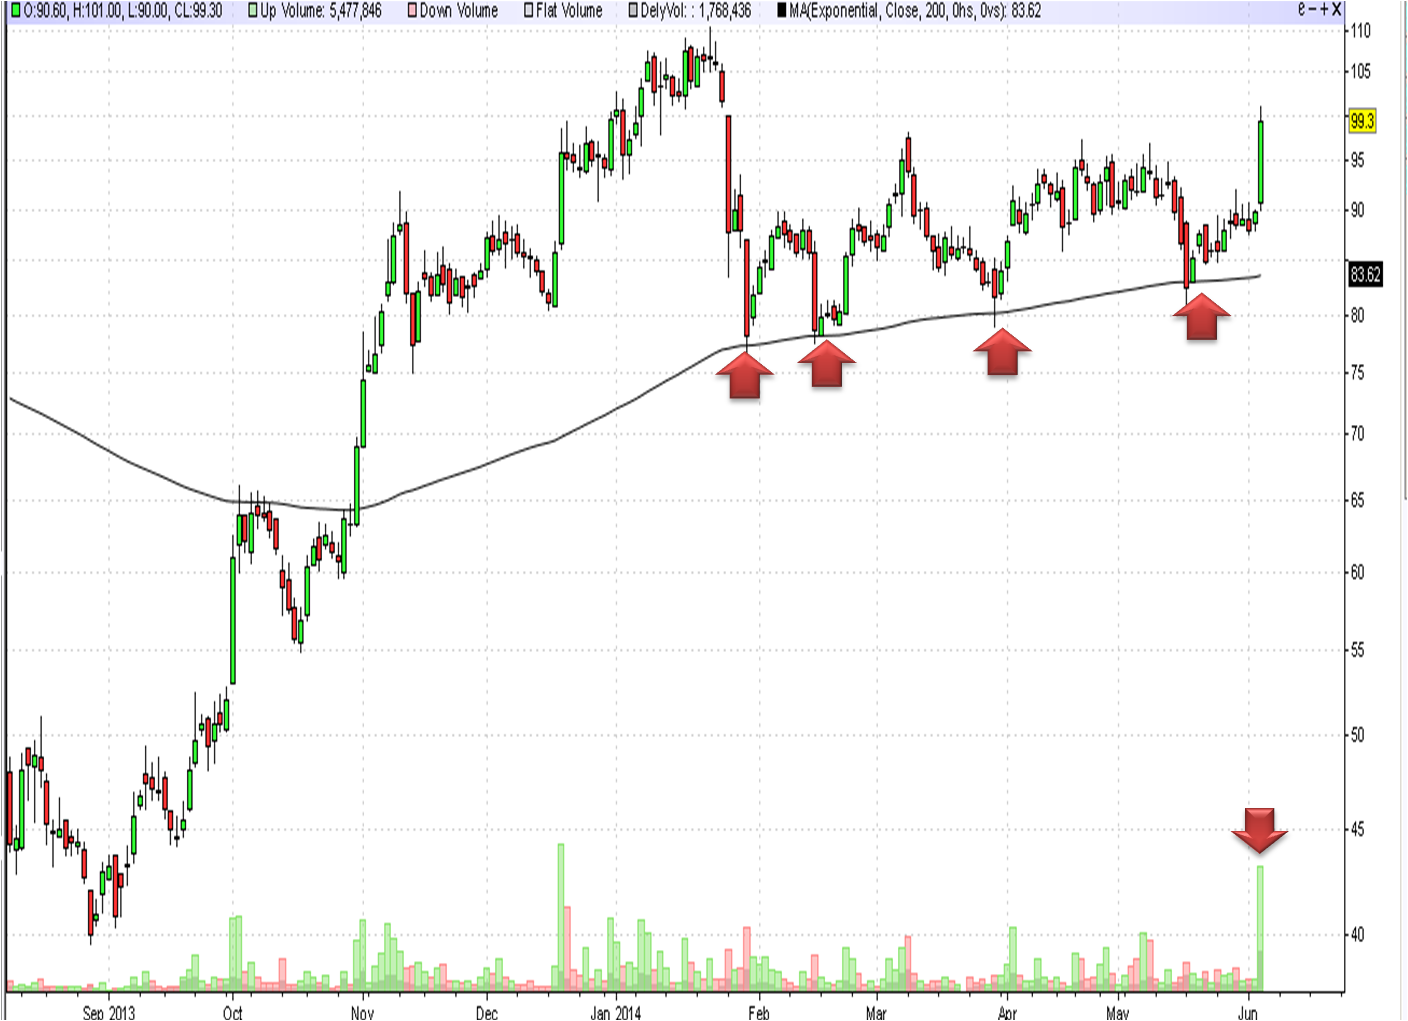
move above the high of 16th of may. This week the market has touched 20 day EMA and the moved up this has happened 3rd time during the last three months. Every time it touched or moved below heavy buying has come. So we have to see whether we move below the low of 16th may or not. Any close below the low of 16th may candle is an indication of weakness and we can see market moving further down as it would signal the movement of market below 20 day EMA. So we have to keep a close watch on market this week. Also we have RBI credit policy this week which would give the idea about the new governments view. The budget is going to be presented in second week of july, so whether the market would correct till then and then move up only we can speculate. Governments view and policies would be out only in budget, So FIIs should be waiting on side lines till that time. And they would jump in if the budget focuses on growth so we have to wait for budget to complete to see for a major move. My view is that we might not make a new high till the budget. But as I say price is the king.
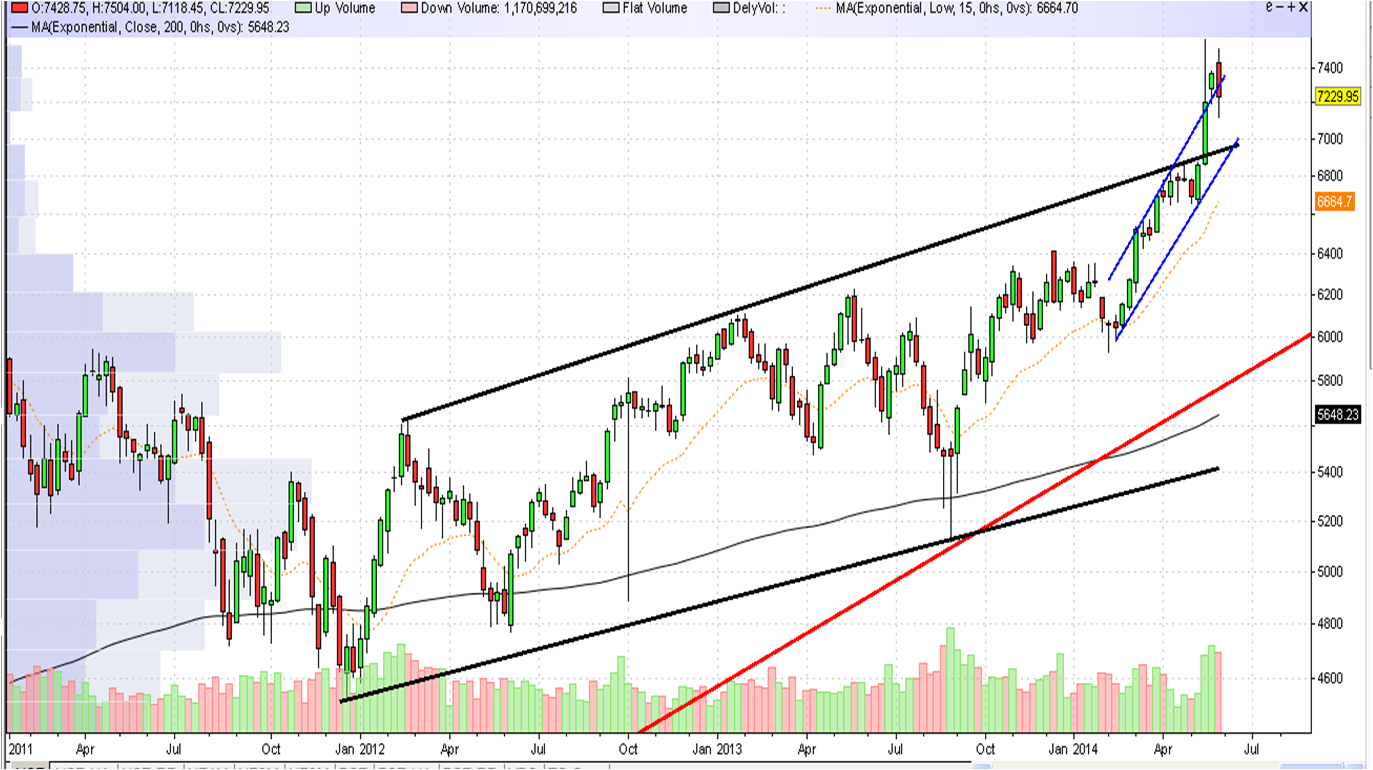
 Above the chart of the nifty for last 2 years, it can be noted that the nifty has broke the trend line of last two years in the month of may and move up and made a new high. But generally when the long term trend line is taken out the market move up comes down takes support/breaks the trend line and then starts to move up and that would be the genuine move or a perfect technical set up. If this is being set up then we can expect the market to move below 7000 towards 6900 levels and then start an up move which can take it to a new high. We have to see the same.  The important event would be when the market takes support or breaks the trend line on down wards. So that event has to be watched with utmost care.

M.MahidaRSri
Trend is Friend
Enjoying Life