Weekly technical Analysis for week ended 9th April 2011.
Movement of nifty during the week was indicating the it has tired of rising and is indicating weakness. The weekly candle is clearly indicating weakness. Unless and otherwise the high of this is taken out in the first two days we can see nifty drifting downwards at-least towards 5600 levels. nifty is still maintain above all the moving averages indicating that the bulls are in upper hand and we have to see whether the same would continue for some more weeks or not. But for the time being nifty is indicating weakness and we might slowly drift down. The only good news for bulls is that the volumes during the week were less and this week the market did not move anywhere so now we have to closely watch the volumes whether it moves up or down. Elliott wave is giving a good indication of the future movement and that would be discussed at appropriate place. Positive for the market: · Nifty is trading below 50 day, 100 day and 200 Day EMA. · Daily MACD is in buy mode. · Weekly MACD has give a buy signal negatives developing: · Daily stochastic oscillator has given sell signal and is moving down. · 50 day EMA is still trading below 200 day EMA indicating weakness. · Monthly MACD has given a sell signal indicating extreme weakness in the market.
Elliott wave analysis:  Generally Elliott wave give a clear picture when there is uncertainty, and Elliotte is giving the same. Last week I have indicated that we might be forming an expanding triangle and we are in formation of the fourth wave and after completion of the same we can see fifth wave developing which would take the market down very swiftly and it would be very violent and also the longest of all the waves. The longest wave till now is of length 1000 points so the fifth wave would be of at-least 1000 length so we have to prepare for the same.
Generally Elliott wave give a clear picture when there is uncertainty, and Elliotte is giving the same. Last week I have indicated that we might be forming an expanding triangle and we are in formation of the fourth wave and after completion of the same we can see fifth wave developing which would take the market down very swiftly and it would be very violent and also the longest of all the waves. The longest wave till now is of length 1000 points so the fifth wave would be of at-least 1000 length so we have to prepare for the same. The pattern is similar to that has been formed in January to may 2004 which is given below: 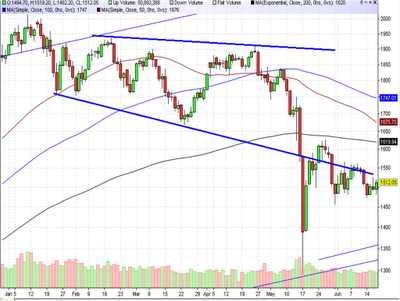 You see the fifth wave which is from around 1900 to around 1300 levels that have been the longest and the most volatile. Whether the same would happen now we have to wait and watch. Generally in an expanding triangle very body gets bullish on completion of the fourth wave and then the market suddenly turns the same seems to be happening now and the same was in April 2004 so we have to see whether the same happens now or not. Just wait and watch.
You see the fifth wave which is from around 1900 to around 1300 levels that have been the longest and the most volatile. Whether the same would happen now we have to wait and watch. Generally in an expanding triangle very body gets bullish on completion of the fourth wave and then the market suddenly turns the same seems to be happening now and the same was in April 2004 so we have to see whether the same happens now or not. Just wait and watch. M.Sri Mahidar
Trend is Friend.
Sunday, April 10th 19.36 IST
No comments:
Post a Comment