Weekly technical Analysis for week ended
14th March 2014
The market during
the week, was on a close range, it has opened on a positive note there after
was in a range then fell on Thursday but recovered the loss on Friday, all in
all in a close range. In the weekly charts the market has formed a doji
indicating that the bulls and bears were no able to decide the direction of the
market. So the coming week is going to decide on the direction of the market. So
technically nothing has happened to the market compared what we have discussed
in last week. One thing is to be noted is that the market was able to sustain above
the all time high for the entire one week which is a positive sign for bulls in
the coming week. The longer the market stays in all time high region bulls
would be happy with the same.
We would see the
time of retracement to see whether the time signifies the strength of the
bulls. We would see the shorter time frame and also larger time frames to see,
what the time lines say about the market.
First we see the shorter
time frame for last two years.
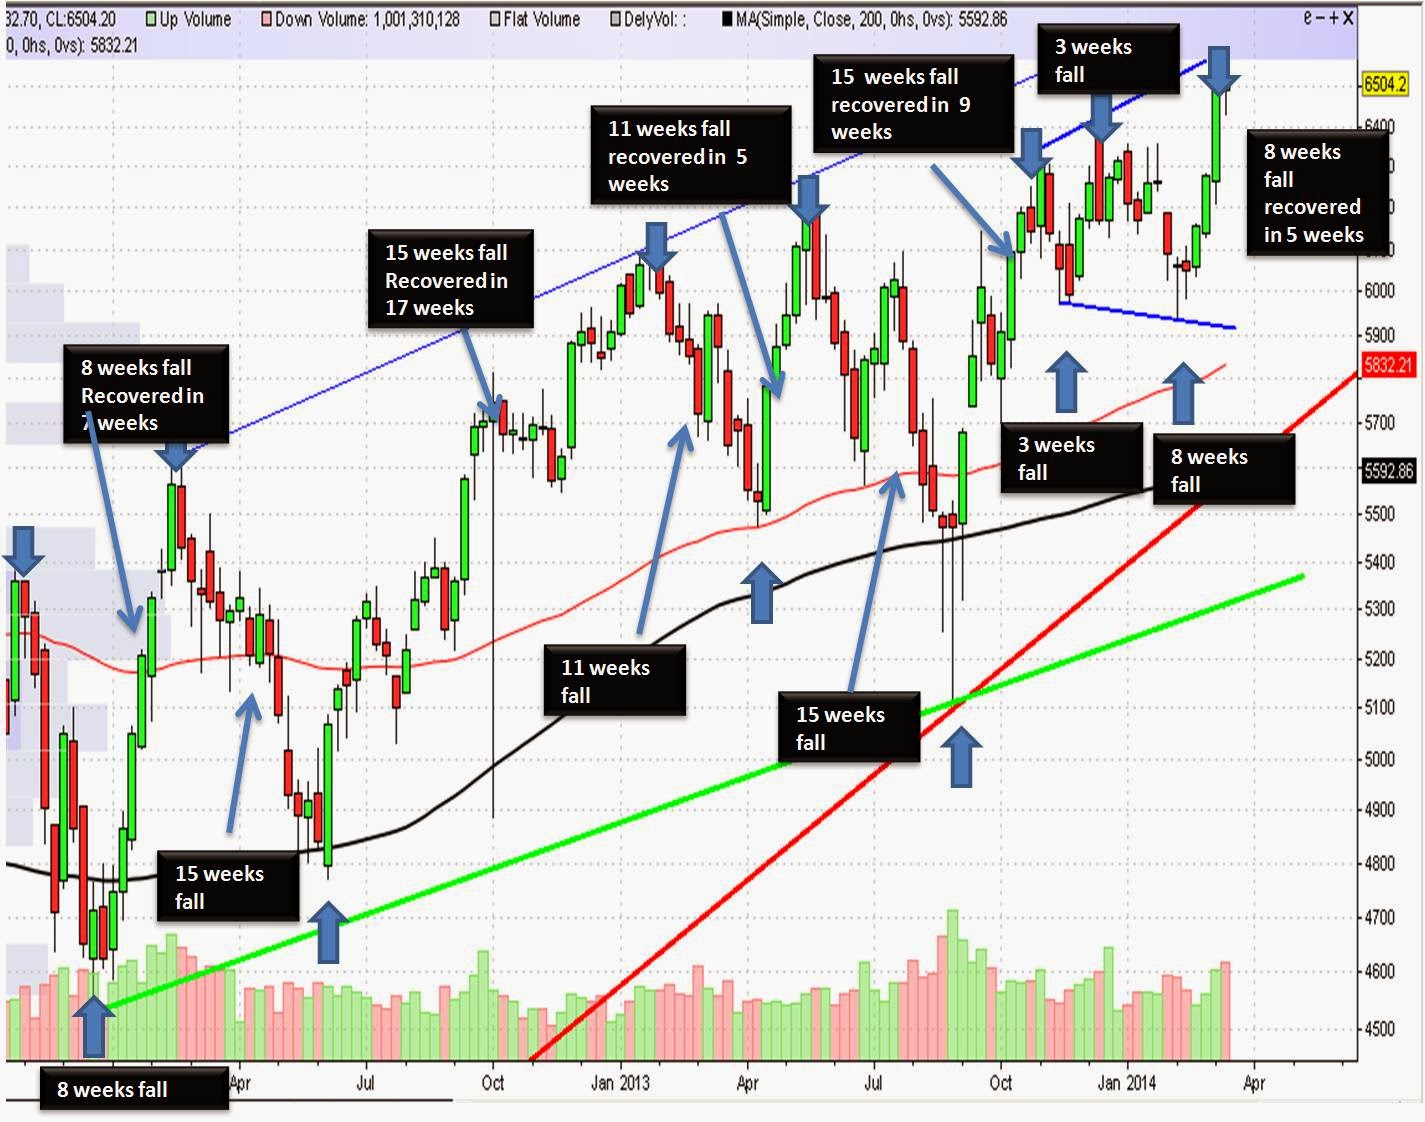
The above chart
is the weekly chart of nifty for the last two years. It can be seen from the
chart above that all the falls of the last two years are being retraced in
shorter period of time, and each fall was taking longer time to fall but unable
to go below the previous low. During the entire period the market has fallen and
the recovery was around 50% of the tme.All this is indicating that all during
the last two years bulls were showing strength and bears were unable to take
the market below their previous lows which was a clear sign of bullishness
which everyone has missed. So till there is faster retracement of the fall the
trend is not reversed in short term also. So till that event happens we can be
sure that the trend has not reversed.
Now we would see for
longer time frame
In Last
three years from November 2010 high.

It can be seen
from the chart that the fall from November 2010 to December 2011 fall was in 60
weeks and the same was recovered from December 2011low to high of December 2013
high took nearly 106 weeks which is nearly 180% of the time taken to fall. I you
see from longer period from January 2008 highs the fall of 2008 took 62 weeks
to fall from 6354 to low of around 2500 and it has taken nearly 254 weeks to recover the entire rise,
the recovery has taken nearly 4 times the time. As Per the Elliott wave the last wave of the
larger wave should e recovered in shorter period to signify the trend reversal
but till not that has not happened so it appears that the larger trend is down
but there is uptrend in shorted term so we have to enjoy with bulls till the
trend reverses in shorter time period till that time bulls would rule.
M.Sri Mahidar
Trend is Friend
16th
of March 2014
No comments:
Post a Comment