Punj Lloyd
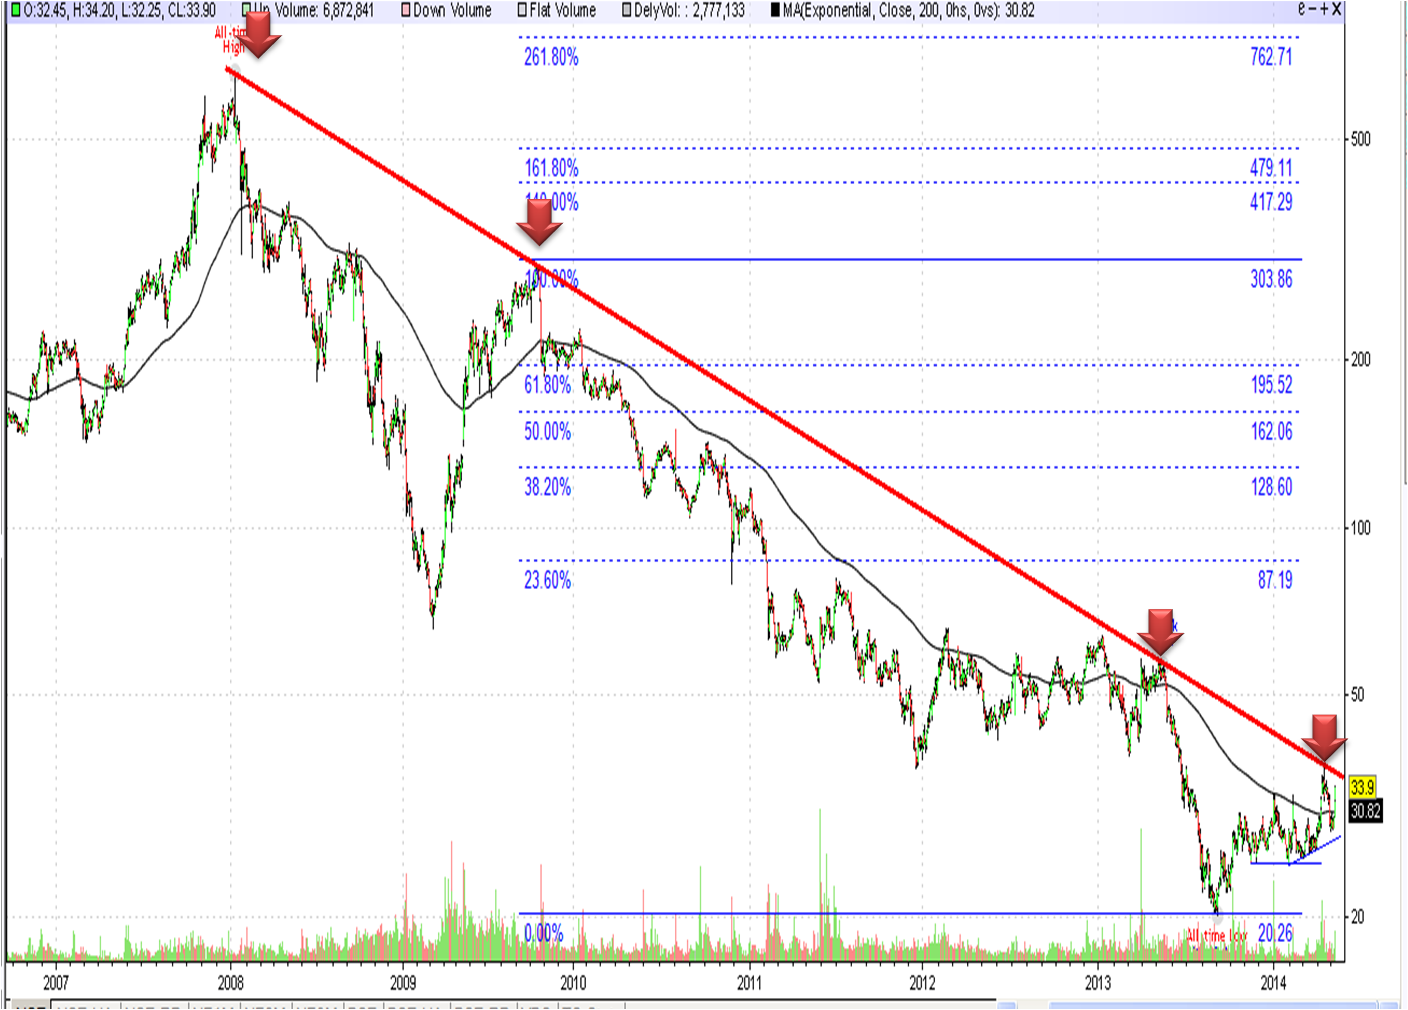

Punj Lloyd:- also seems to be comming out of hibernation after nearly 6 years, it has been falling continually from 2008 as its financial position was continually becoming worst. if you see the chart from 2008 onwards the stock has been trading below 200 day EMA except for a three to four months in 2009. Now it has currently moved above 200 day EMA. If you see the second chart it has tried twice in last six months and failed indicated by red down facing arrows and in the third attempt it has moved above it then it retraced and move below it and not strongly moved above it which is a perfect technical set up as the stop loss is just near only the margin of safety is high. another point ot be noted is that if you can see in the first chart any move above 37 would result in the sloping trend line drawn from the top of 2008 is taken out which generally signifies a trend reversal in the stock. So watch out for Rs.36 as any move above it would trigger an upside movement of at-least 50% from that levels. Fundamentals have still not improved but generally technical s first show the reversals followed by fundamentals. So as of now its a technical buy with stright stop loss of Rs.28.
M.Mahidar Sri
Trend is Friend.
No comments:
Post a Comment